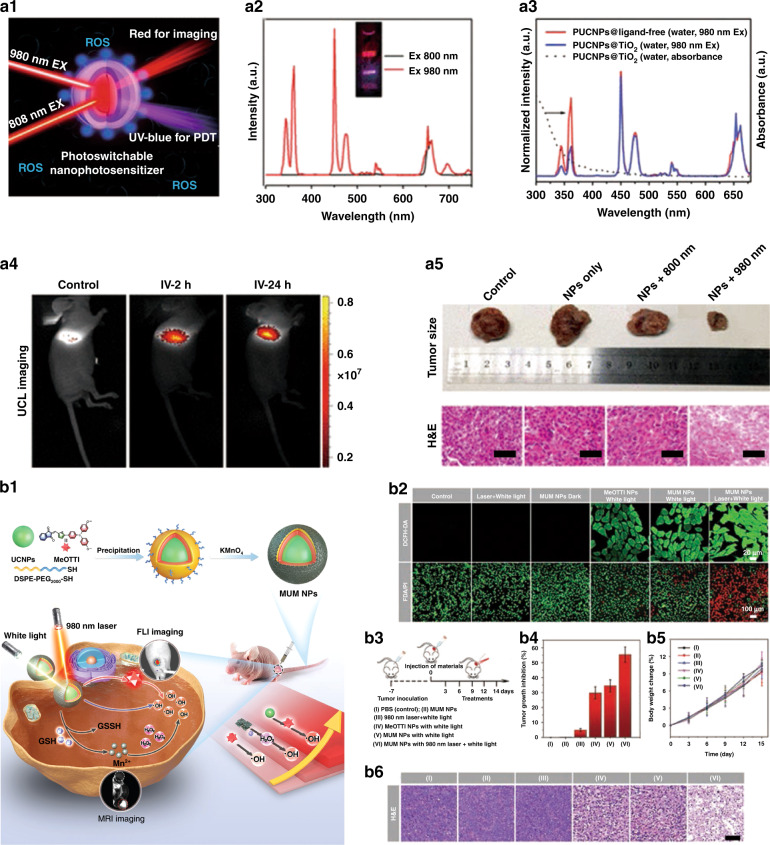
Fig. 7. Photodynamic therapy.
a1 Schematic of PUCNPs@TiO2 nanocomposites for imaging guided PDT. a2 Upconversion emission spectra of PUCNPs excited by 800 or 980 nm laser (5 W cm−2). Inset: luminescence photograph of PUCNPs in cyclohexane under irradiation by two laser beams (0.8 W cm−2). a3 UCL spectra of PUCNPs@ligand-free (red line) and PUCNPs@TiO2 (blue line), the absorbance spectra of PUCNPs@TiO2 (dotted line). a4 UCL imaging in LLC tumor-bearing mouse after intravenous injection of PUCNPs@TiO2 for 2 and 24 h (800 nm irradiation). a5 The digital photographs of excised tumors after various treatments and H&E-stained slices of tumor tissues collected from different groups. The scale bars stand for 50 μm118. b1 Schematic illustration of fabrication of MUM NPs and dual-modal imaging guided triple-jump PDT. b2 DCFH-DA assay for intracellular ROS level (upper row) and FDA/PI assay for live/dead cell staining (lower row) of 4T1 cells after different treatments. b3 Schematic diagram of the operation process of antitumor therapy. b4 Tumor inhibition ratios of different groups after various treatments on day 14. b5 Body weight profiles of mice under different treatments. b6 H&E staining analysis of tumor tissues collected from different groups127. a1–a5 Reprinted with permission from ref. 118 Copyright 2018, American Chemical Society. b1–b6 Reprinted with permission from ref. 127 Copyright 2021, John Wiley and Sons

