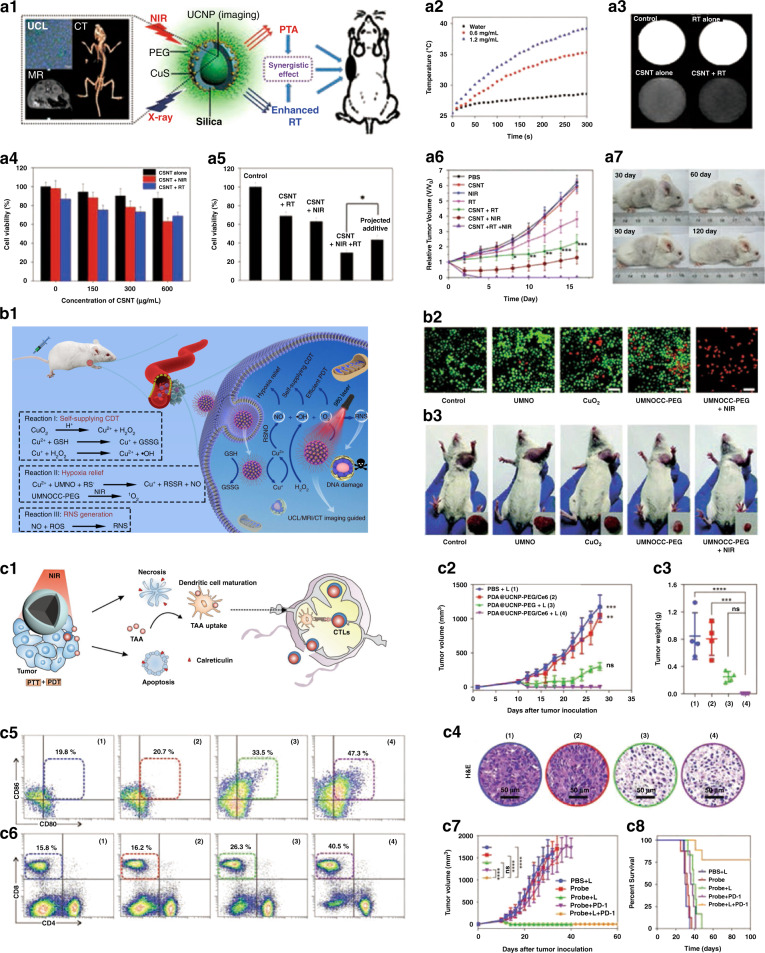
Fig. 8. Synergistic cancer therapeutics.
a1 Schematic illustration of CSNT for imaging-guided RT/PTA synergistic therapy. a2 Temperature variation of CSNT solutions irradiated by a 980 nm NIR laser (1.5 W cm−2, 5 min). a3 The impact of CSNT on the X-ray radiation dose. a4 Viability of HeLa cells incubated with CSNTs at different concentrations with or without 980 nm laser irradiation and RT. a5 Viability of HeLa cells that have taken up CSNTs treated with RT, PTA, and RT/PTA. a6 Relative tumor growth curves of different groups. a7 Digital photographs of mice from group 7 after 30, 60, 90, and 120 days of treatment22. b1 Schematic illustration of UMNOCC-PEG for imaging-guided tumor therapy. b2 CLSM images of HeLa cells co-stained with calcein AM (live cells, green) and PI (dead cells, red) after different treatments (0.5 W cm−2, 500 μg mL−1). b3 Photographs of the representative mice and excised tumors137. c1 Schematic illustration of synergistic phototherapy to enhance antitumor immunity. Tumor growth curve (c2), tumor weight (c3), and representative H&E staining (c4) of 4T1 tumor-bearing mice after different treatments. Detection of DC maturity (CD80+CD86+ gated on CD11c+) in tumor-draining lymph nodes (c5) and CTLs (CD4−CD8+ gated on CD3+) in the spleen (c6) by flow cytometry. Mean tumor growth kinetics (c7) and corresponding survival rates (c8) of mice after different treatments139. a1–a7 Reprinted with permission from ref. 22 Copyright 2013, American Chemical Society. b1–b7 Reprinted with permission from ref. 137 Copyright 2020, The Royal Society of Chemistry. c1–c8 Reprinted with permission from ref. 139 Copyright 2019, John Wiley and Sons

