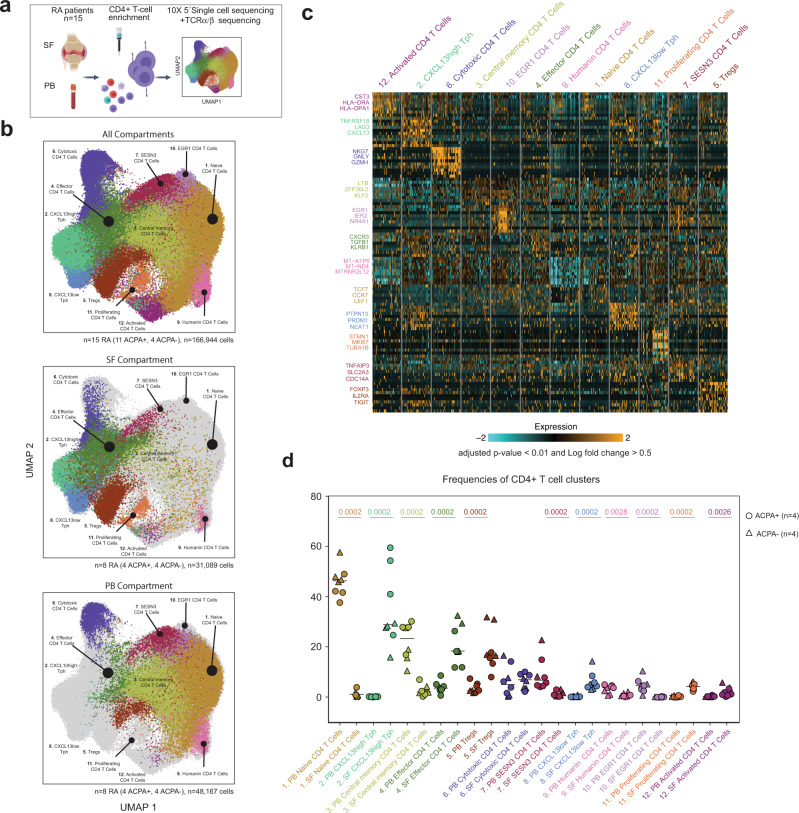
Fig. 2. Single-cell RNA sequencing of CD4+ T cells from SF and PB of RA patients.
a Technical workflow including CD4+ T-cell enrichment and 10X 5′ single-cell sequencing coupled to TCRαβ sequencing on 15 paired PB and SF from RA patients (11 ACPA+, 4 ACPA−). b UMAP displaying 12 CD4+ T-cell clusters in combined SF and PB (upper panel, n = 15 RA (11 ACPA+, 4 ACPA−), n = 166,944 cells), SF (middle panel, n = 8 RA (4 ACPA+, 4 ACPA−), n = 31,089 cells) and PB (lower panel, n = 8 RA (4 ACPA+, 4 ACPA−), n = 48,167 cells). c Heatmap showing selected differentially-expressed genes (DEGs) in the different CD4+ T-cell clusters in combined PB and SF, P < 0.01, model-based analysis of single-cell transcriptomics (MAST). d Frequencies of CD4+ T-cell clusters in PB and SF from n = 8 RA patients (4 ACPA+, 4 ACPA−). Circle indicates ACPA+ RA patients, triangle indicates ACPA− patients. Line represents median, two-tailed Mann–Whitney U test.

