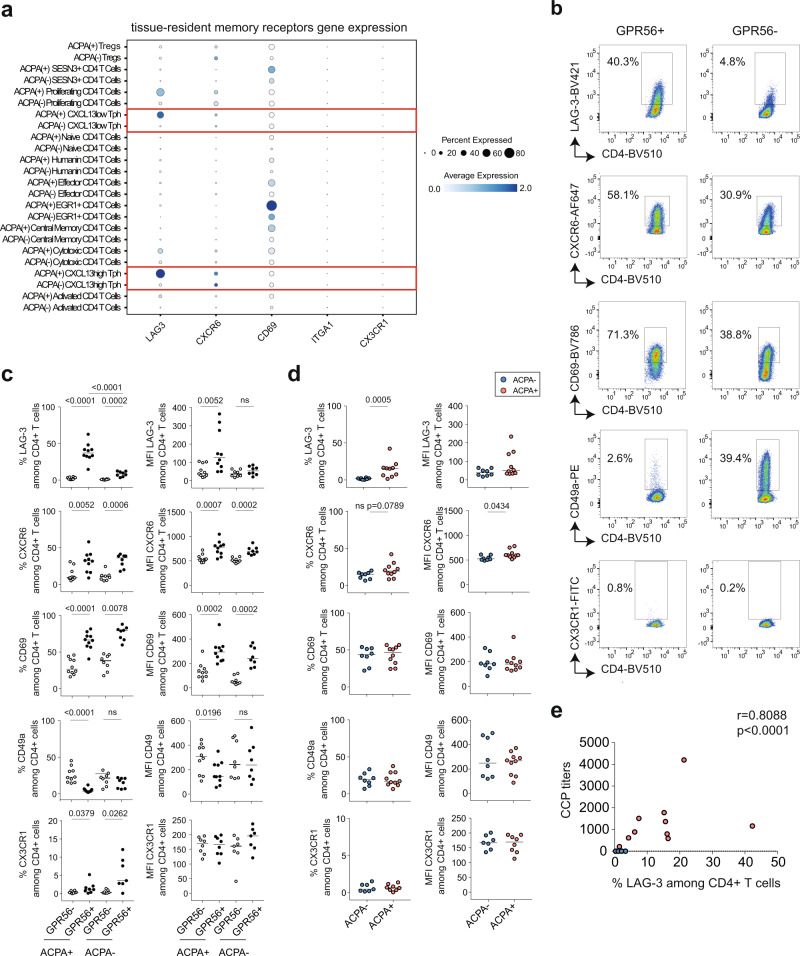
Fig. 4. Tissue-resident memory receptors on CD4+ T cells in ACPA+ and ACPA− RA SF.
a 2-D dot plots showing the expression of selected genes in the different CD4+ T-cell clusters in ACPA+ and ACPA− SF (circle size indicates the percentage of cells expressing, color intensity indicates average expression) (n = 4 ACPA+, n = 4 ACPA− RA SF). b Representative flow cytometry dot plots showing the expression of LAG-3, CXCR6, CD69, CD49a, and CX3CR1 on GPR56+ and GPR56− CD4+ T cells in ACPA+ RA, quantified in ACPA+ and ACPA− SF in c) P < 0.0001 (%LAG-3), P = 0.0052 (%CXCR6), P < 0.0001 (%CD69), P < 0.0001 (%CD49a), P = 0.0379 (%CX3CR1) in GPR56− versus GPR56+ in ACPA+ SF; P = 0.0002 (%LAG-3), P = 0.0006 (%CXCR6), P = 0.0078 (%CD69), ns (%CD49a), P = 0.0262 (%CX3CR1) in GPR56− versus GPR56+ in ACPA− SF; P < 0.0001 (%LAG-3) in GPR56+ in ACPA− versus ACPA+; P = 0.0052 (MFI LAG-3), P = 0.0007 (MFI CXCR6), P = 0.0002 (MFI CD69), P = 0.0196 (MFI CD49a) in GPR56− versus GPR56+ in ACPA+ SF; ns (MFI LAG-3), P = 0.0002 (MFI CXCR6), P = 0.0002 (MFI CD69), ns (MFI CD49a) in GPR56− versus GPR56+ in ACPA − SF; (n = 10 ACPA+, n = 8 ACPA−, LAG-3, CXCR6, CD69, CD49a) (n = 8 ACPA+, n = 7 ACPA−, CX3CR1). White dots indicate GPR56− CD4+ T cells and black dots indicate GPR56+ CD4+ T cells. d Expression of LAG-3, CXCR6, CD69, CD49a and CX3CR1 on CD4+ T cells in SF; P = 0.0005 (%LAG-3 in ACPA− versus ACPA+); (n = 8 ACPA−, n = 10 ACPA+, LAG-3, CXCR6, CD69, CD49a) and (n = 7 ACPA−, n = 8 ACPA+, CXC3CR1). Blue dots indicate ACPA− RA SF and red dots indicate ACPA+ RA SF. c, d Line represents median, two-tailed Mann–Whitney U test. Data are from a pool of eight independent experiments where a circle is a single replicate. e Correlation between the frequency of LAG-3 in CD4+ T cells in RA SF and the levels of anti-CCP (cyclic citrullinated peptide) antibodies (n = 18), P < 0.0001, Spearman two-tailed test. ns not significant.

