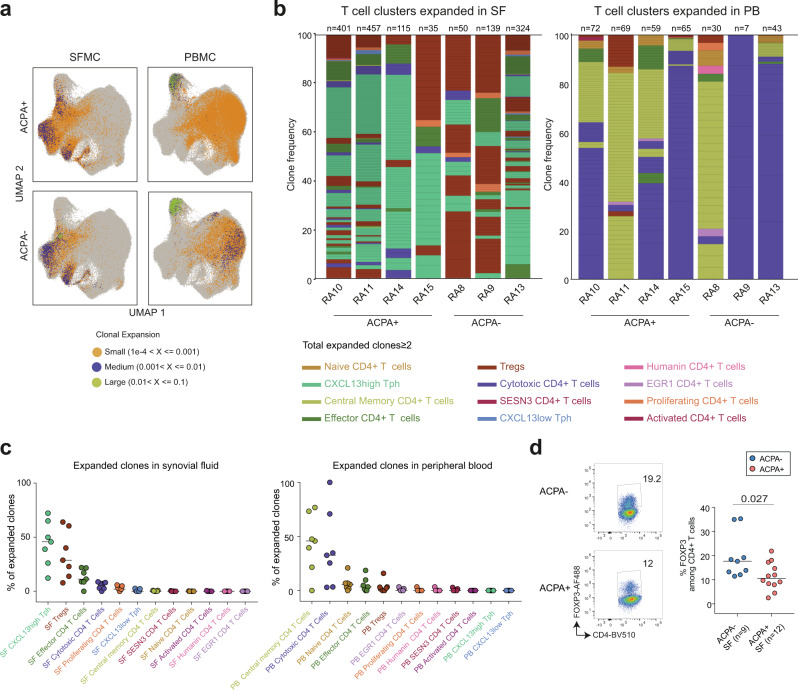
Fig. 5. Clonally expanded CD4+ T cells in RA.
a UMAP plots showing expanded clones in ACPA+ (n = 4) and ACPA− (n = 4) RA PB and SF, colored based on sample size. Orange dots indicate small clones (1e-4 < X ≤0.001), purple dots indicate medium size clones (0.001 < X ≤0.01), green dots indicate large size clones (0.01 < X ≤0.1). Each dot displays a cell. b Stacked barplots displaying the phenotype of the SF (left) and PB (right) expanded clones (n ≥ 2 cells) in each RA patient, quadrant represents an individual clone, total number of clones per patient are indicated above each column. c Frequency of expanded clones within each CD4+ T-cell cluster in SF (left panel) and PB (right panel) for each RA patient (n = 4 ACPA+, 3 ACPA−). d Frequency of FOXP3+ cells among CD4+ T cells in ACPA− (n = 9) and ACPA+ (n = 12) RA SF, P = 0.027. Data are from a pool of nine independent experiments where a circle is a single replicate. Blue dots indicate ACPA− RA SF and red dots indicate ACPA+ RA SF. Line represents median, two-tailed Mann–Whitney U test.

