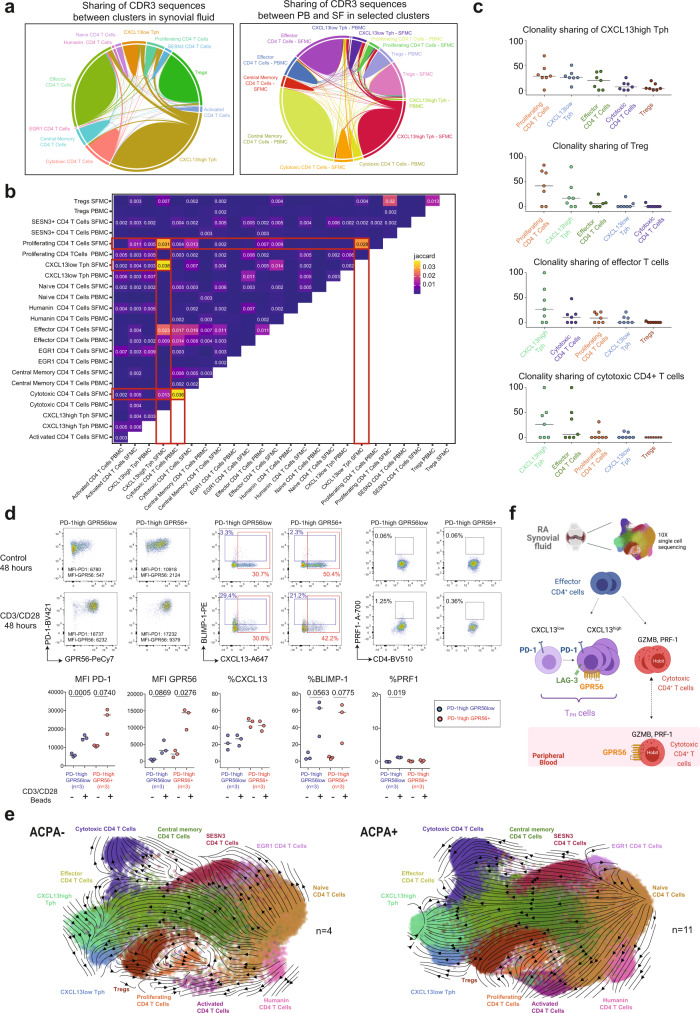
Fig. 6. CD4+ T-cell subsets interconnectivity.
a Chord diagrams showing the interconnectivity between CD4+ T cells sharing the same CDR3 (paired TCRα, and TCRβ chains) amino acid sequences within CD4+ T-cell clusters in RA SF (left panel) and between compartments in selected clusters (right panel) (n = 4 ACPA−, n = 4 ACPA+). b Jaccard overlap quantifications for clonal overlap between cell clusters across compartments (n = 4 ACPA−, n = 4 ACPA+). c Percentage of shared expanded clones (n ≥ 2 cells) shared with selected subsets among total cell clones, n = 7 RA patients (n = 4 ACPA+, 3 ACPA−). d Representative flow cytometry dot plots showing the expression of PD-1, GPR56, CXCL13, BLIMP-1, and PRF1 in control (upper panel) or after 48 h CD3/CD28-beads activation of TPH cell states (lower panel) (PD-1highGPR56low and PD-1highGPR56+ from ACPA+ SF), quantified in n = 3 ACPA+ RA patients. d Data are from a pool of three independent experiments where a circle is a single replicate. Line indicates median, two-tailed Wilcoxon paired test, P = 0.0005 (MFI PD-1 on PD-1highGPR56low after activation), P = 0.0740 (MFI PD-1 on PD-1highGPR56+ after activation), P = 0.0869 (MFI GPR56 on PD-1highGPR56low after activation), P = 0.0276 (MFI GPR56 on PD-1highGPR56+ after activation), P = 0.0563 (% BLIMP-1 on PD-1highGPR56low after activation), P = 0.0775 (% BLIMP-1 on PD-1highGPR56+ after activation), P = 0.019 (% PRF1 on PD-1highGPR56low after activation). e Velocity plots showing the phenotype directionality between the different CD4+ T-cell clusters in RA split in ACPA− (left panel) and ACPA+ (right panel) (n = 4 ACPA−, n = 11 ACPA+, pool PB and SF). f Graphical summary showing the proposed developmental link between the two TPH subsets, effector and cytotoxic CD4+ T cells in SF as well as the identified receptors.

