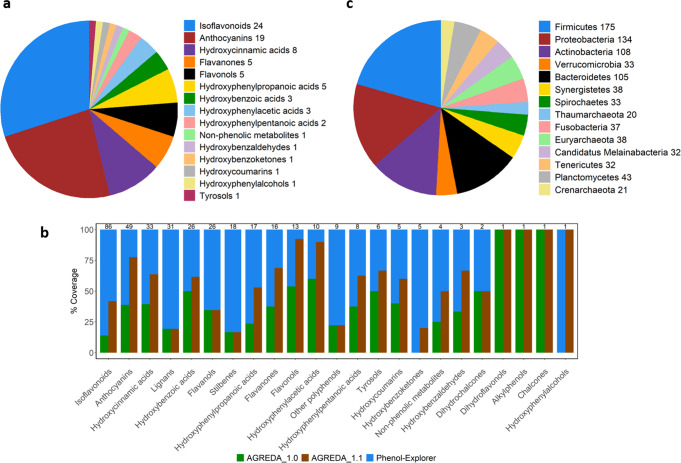
Fig. 2. Main metabolic features included in AGREDA_1.1.
a Representation of the different sub-classes of input phenolic compounds added to AGREDA_1.1. The number of compounds captured by AGREDA_1.1 for each sub-class is detailed in the legend, e.g. ‘Isoflavanoids 24’; (b) Barplot showing the percentage coverage of AGREDA_1.0 and AGREDA_1.1 in terms of phenolic compounds included in Phenol-Explorer19. The number at the top of the bars is the total number of phenolic compounds for each sub-class, e.g. 86 compounds for Isoflavanoids; (c) Contribution of different phyla to the reactions added to AGREDA_1.1. The number of reactions added to AGREDA_1.1 present in each phylum is also provided in the legend, e.g. ‘Firmicutes 175’. Source Data are provided as a Source Data file.

