Figure 3.
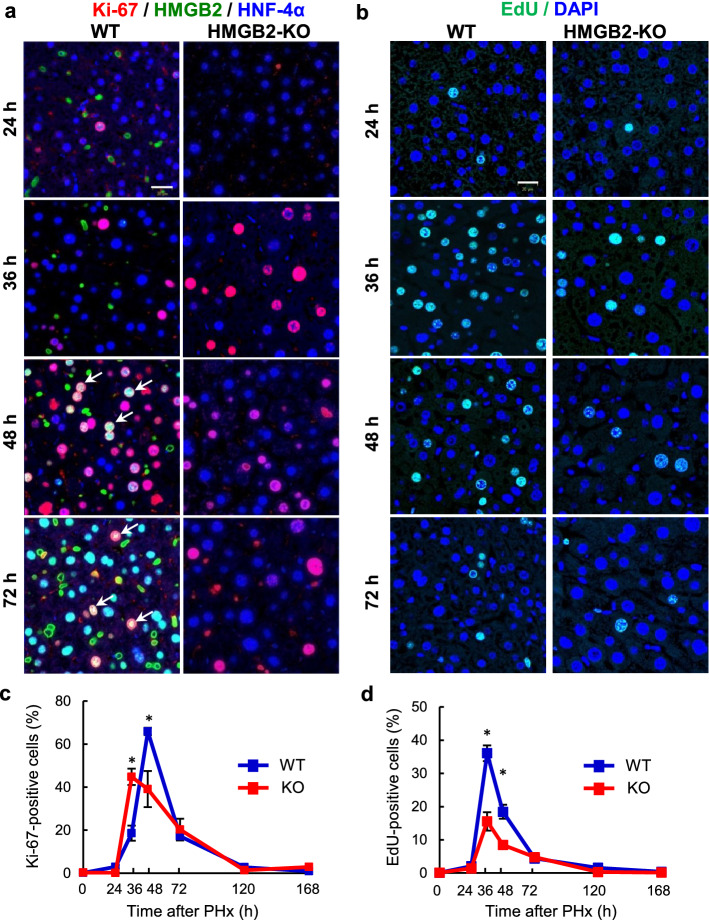
Expression of Ki-67 and EdU during liver regeneration. (a) Immunofluorescence for Ki-67 (red), HMGB2 (green) and HNF-4α (blue) in WT and HMGB2-KO mouse livers after PHx. Arrows indicate HMGB2- and Ki-67-positive hepatocytes. (b) EdU (green) and DAPI (blue) staining in WT and HMGB2-KO mouse livers after PHx. Scale bar 20 μm. Counting results of Ki-67-positive cells (c) and EdU-positive cells (d) in WT and HMGB2-KO mouse livers. Data represent the mean ± SEM from 5–6 mice per group. Asterisks indicate statistically significant differences (*p < 0.05).

