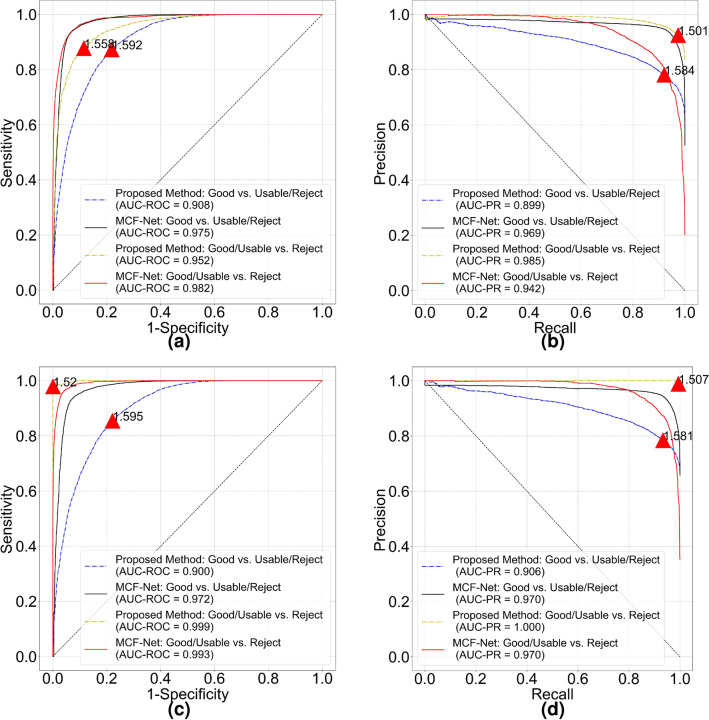
Figure 5.
Performance comparison of the MCF-Net and proposed methods for classifying “Good” and “Reject” images in EyeQ test set. (a) ROC and (b) PR curves are measured on the original labels from human graders. We show revised ROC and PR curves in (c,d) to indicate classification performance after removing potential incorrect labels. Red triangle and numerical digit on each curve indicate the optimal cut off point and FD threshold of the proposed method.

