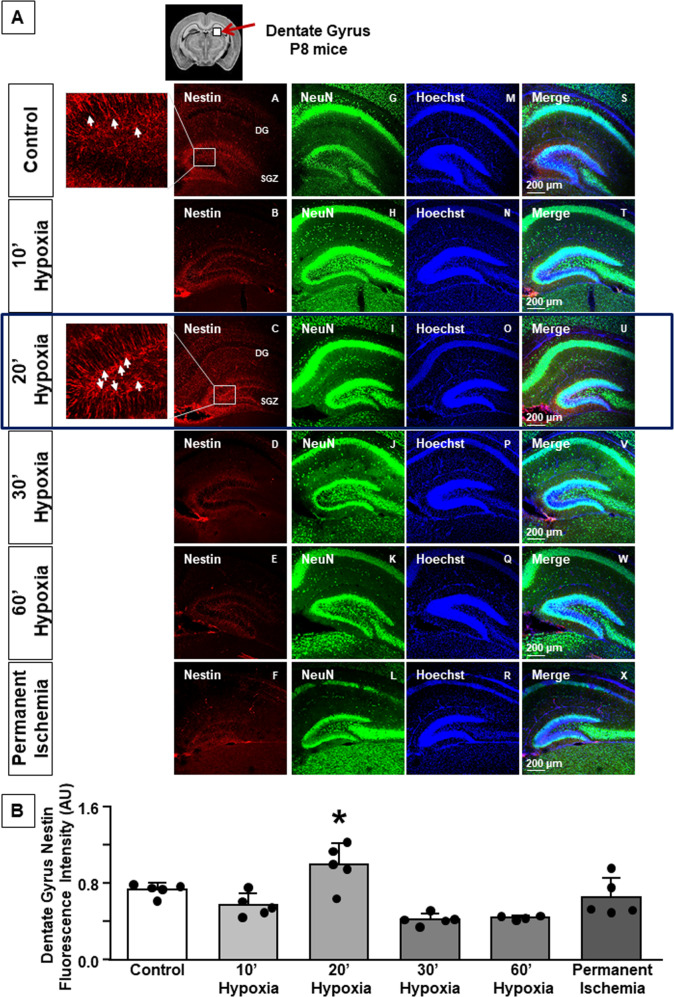
Fig. 1. Nestin fluorescence intensity in dentate gyrus of P8 mice.
A Representative confocal images of DG of control, 10’ hypoxia, 20’ hypoxia, 30’ hypoxia, 60’ hypoxia, permanent ischemia groups. Single staining of Nestin (A, B, C, D, E, F); NeuN (G, H, I, J, K, L), Hoechst (M, N, O, P, Q, R), and merge (S, T, U, V, W, X) in mouse dentate gyrus of six groups. Scale bar 200 μm. Rectangular box indicates area of high magnification ×400 zoom. Arrows indicate radial glial-like Nestin expressing cells. B Quantification of Nestin fluorescence intensity in dentate gyrus (expressed in arbitrary units, AU). Data are expressed as mean ± SD (n = 4–5). *P < 0.05 versus control mice. P-values were obtained by using one-way ANOVA with Newman–Keuls correction for multiple comparisons.

