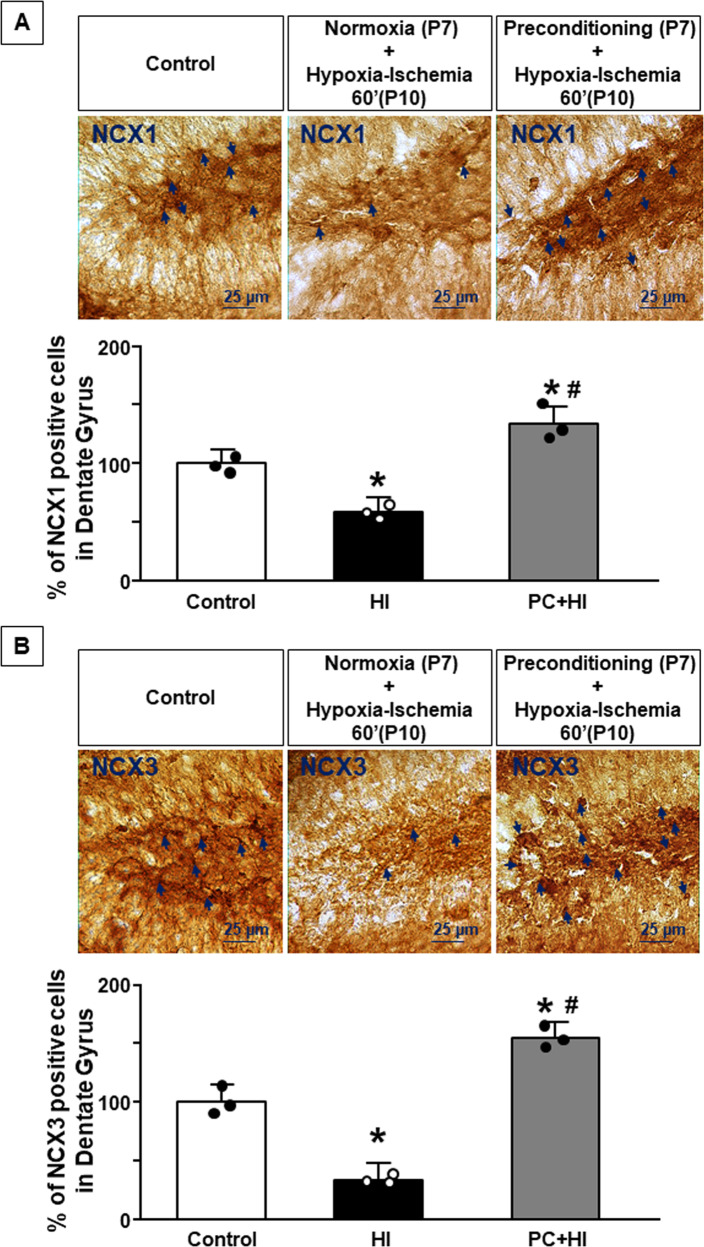
Fig. 4. NCX1 and NCX3 expression in the dentate gyrus after HPC.
A Representative image of NCX1 3,3′-diaminobenzidine (DAB) staining of dentate gyrus of control, HI, and PC + HI groups. Scale bar 25 μm. Arrows indicate NCX1 expressing cells. Cell-counting analysis was expressed as the percentage of total number of NCX1+cells in dentate gyrus of P11 mice. B Representative image of NCX3 DAB staining of dentate gyrus of control, HI, and PC + HI groups. Scale bar 25 μm. Arrows indicate NCX3 expressing cells. Cell-counting analysis was expressed as the percentage of total number of NCX3+ cells in dentate gyrus of P11 mice. A, B Data are expressed as mean ± SD (n = 3). *P < 0.05 versus control mice. #P < 0.05 versus mice group subjected to HI only. P-values were obtained by using one-way ANOVA with Newman–Keuls correction for multiple comparisons.

