Figure 2.
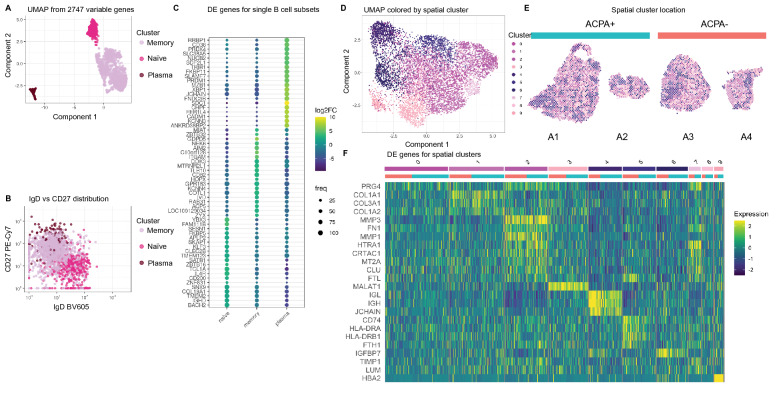
Identification of synovial B cell clusters and assessment of context relevant markers. (A) The UMAP dimensionality reduced B cell transcriptome from A2–A4 reveals the presence of a naïve, a memory and a plasma cell cluster. (B) The scRNAseq annotation translates back onto the expected phenotypic protein expression by flow cytometry. (C) Average log2FC and robustness of expression for differentially expressed (DE) genes of B cell transcriptomes show marker genes for naïve, memory and plasma cells. (D) UMAP on spatial transcriptomics data colored with the ten nearest neighbor clusters. (E) Clusters are shown on the tissue sections. ACPA+ samples are indicated by turquoise color, and ACPA− in orange. (F) Differentially expressed genes between the ten clusters (indicated by same colors as in (D). Cluster 4 shows genes strongly associated to plasma cells.

