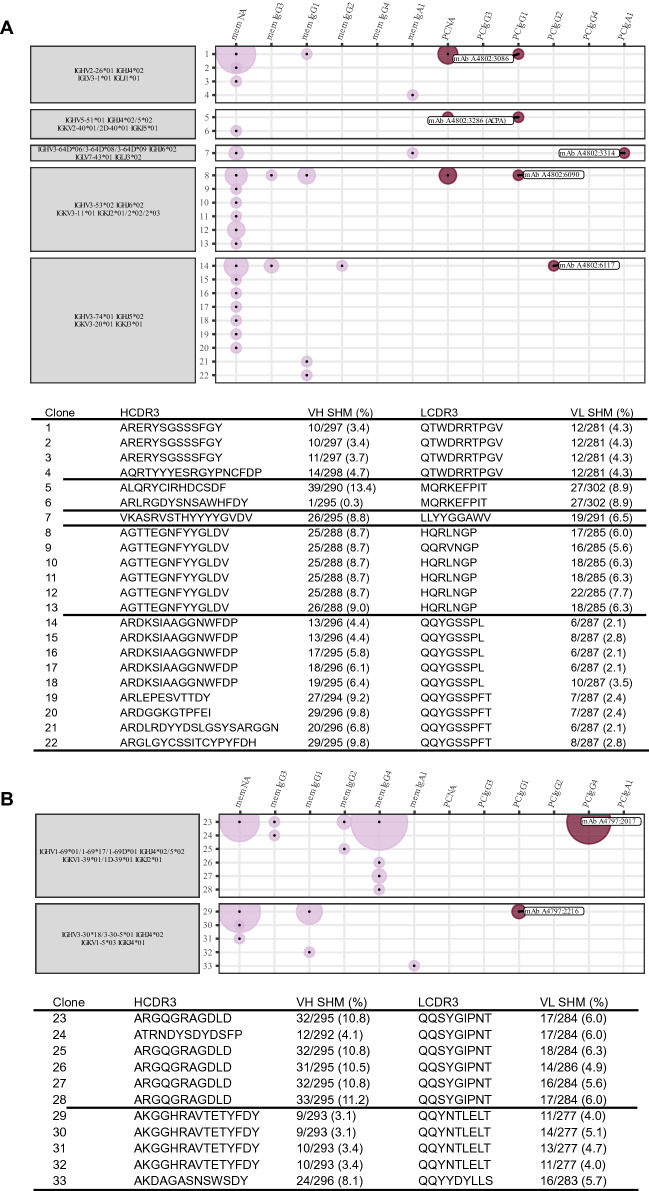
Figure 5.
Clonotype characterization of synovial plasma cell derived antibodies. (A) We show clonotypes for five plasma cell derived monoclonal antibodies from A2. Each clonotype is defined by identical heavy and light chain V and J gene usage (grey boxes). Each clone with a unique sequence for the combination of heavy and light chain is assigned a number (y-axis). This sequence is described by the SHM and the complementary determining region 3 (CDR3) for the heavy and light chain in the table below. The x-axis and dot color depict the memory B (mem) or plasma cell (PC) cluster identity of the clone members by transcriptomic profile. It additionally defines the heavy chain isotype of the clone members in the order of possible class switch recombination from left to right. NA means not available from the data. The area of the dots is proportional to the number of identified members; e.g. the largest area within the first clone is equivalent to 16 members while the smallest area is equivalent to 1 member. (B) The plot shows the equivalent clonotype information that is shown in panel (A) for the two plasma cell derived monoclonal antibodies from A3.

