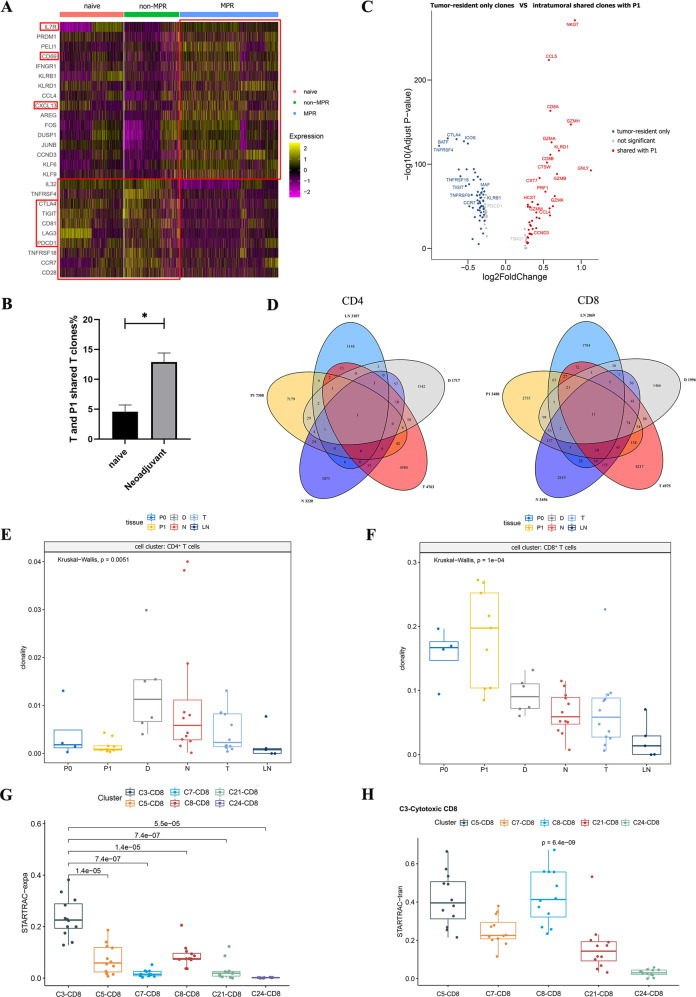
Fig. 4. Reinvigoration and clonal expansion of CD8+ T cells and their association with neoadjuvant response.
A Heatmap showing the DEGs of CD8+ T cells in treatment-naive, non-MPR, and MPR tumor tissues. The exhausted state of CD8+ T cells was greatly improved in MPR tumor lesions. B. Comparison of shared T clone between Tumor and P1 in treatment-naive and neoadjuvant tumor lesions. There are more shared T clones between tumors and P1 in neoadjuvant tumor lesions. Data presented as mean ± SEM. P value was determined by the Mann–Whitney test, two-tailed. *p < 0.05. C The volcano map shows the comparison of DEGs between tumor-resident only T clones and shared T clones with P1 in tumor lesions, the shared T clones were more cytotoxic, while tumor-resident only T clones were more exhausted. D Venn diagram showing the shared clonotype between different tissues, there are more shared CD8+ T clones than CD4+ T clones between tissues. E, F Comparison of the clonality of CD4+ and CD8+ T cells in different tissue types. The CD8+ T clones were widely expanded in various tissues, and were more obvious in P1 than P0. P values were determined by the Kruskal–Wallis test. G STARTRAC-expa index revealed the C3-cytotoxic CD8+ T cluster with the highest degree of clonal expansion compared to other CD8+ T clusters. H STARTRAC-tran analysis indicated that the C3-cytotoxic CD8+ T cluster was highly associated with both C5-CD8-IL7R and C8-CD8-GZMK clusters. P values were determined by the Wilcoxon test, two-tailed.

