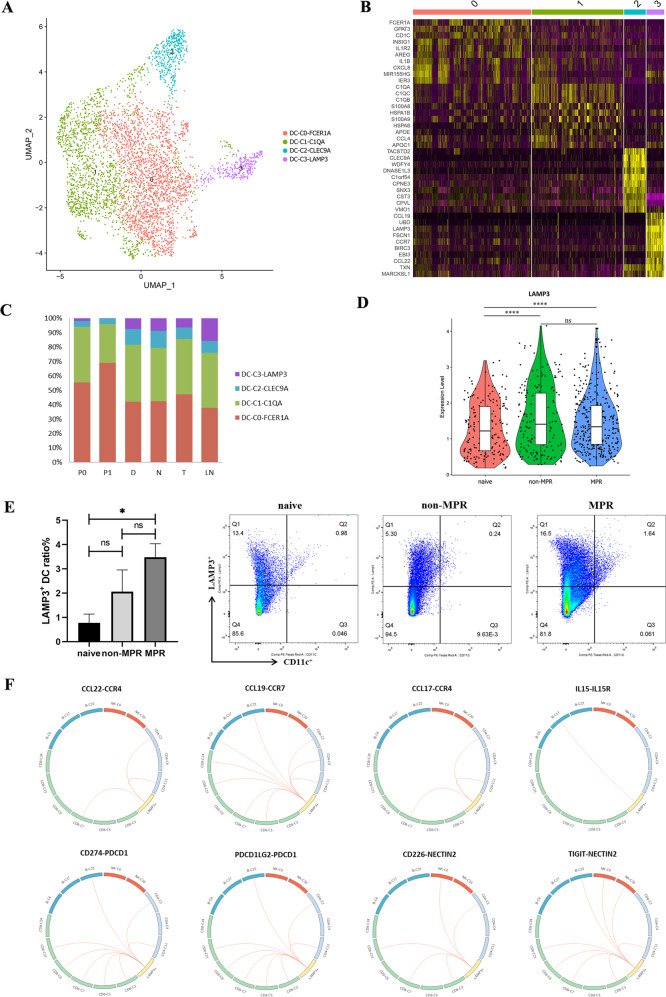
Fig. 6. Characteristics and L-R interactions of DCs and Lymphocytes and their association with clinical outcome.
A UMAP plot showing the clusters of DC subsets. Each dot represents a single cell. Color represents cluster. B Heatmap showing the DEGs of DC subsets. The maturation markers LAMP3, chemokine, and chemokine receptor CCL19, CCR7, and CCL22 were highly expressed in DC-C3-LAMP3. C Tissue distribution analysis of the four DC clusters, DC-C3-LAMP3 was mainly distributed in tumors, LNs, and nearest or distal normal tissues, and was rarely seen in peripheral blood. D The violin plot tested with Wilcoxon showing LAMP3 expression level in treatment-naive, non-MPR and MPR patients. ****p < 0.0001, ns: not significant. E LAMP3+ DC ratio in tumor tissues detected by flow cytometry. The proportion of LAMP3+ DC cells was significantly higher in neoadjuvant MPR tumor lesions. Data presented as mean ± SEM. Data were summarized from n = 4 treatment-naive, n = 6 non-MPR and n = 6 MPR tumor samples. P values were determined by the Kruskal–Wallis test. *p < 0.05, ns: not significant. F L-R based interaction of LAMP3+ DCs and lymphocytes predicted by CellPhone DB.

