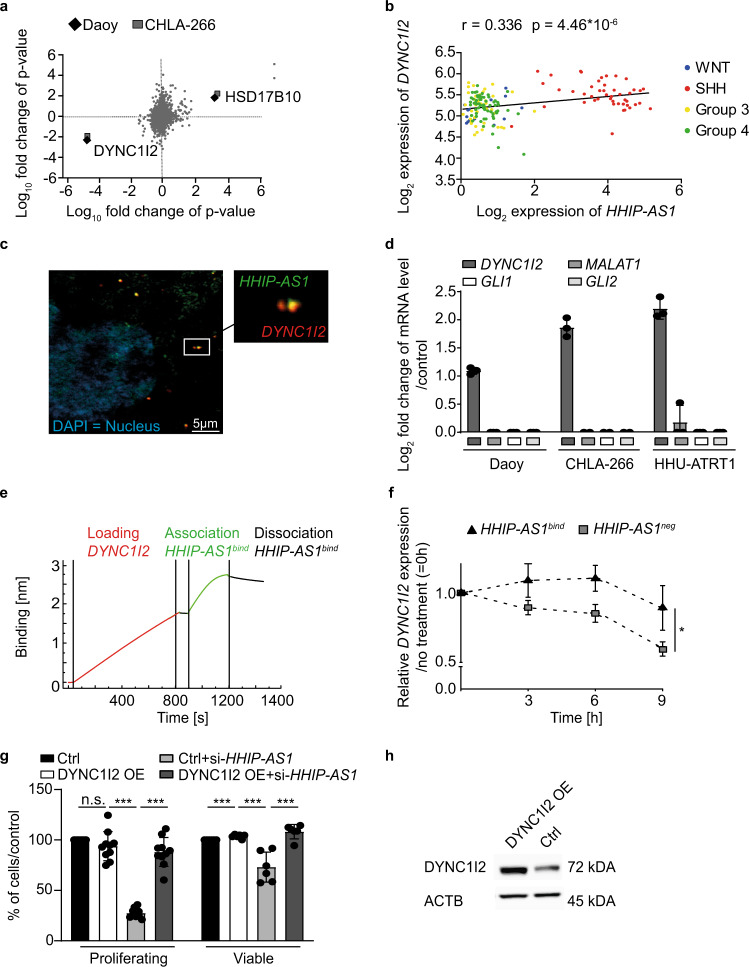
Fig. 3. Identification and functional validation of HHIP-AS1 downstream targets reveals that HHIP-AS1 binds to mRNA of DYNC1I2.
a Scatter plot indicates the correlation analysis of RNA sequencing (x-axis) and protein mass spectrometry (y-axis) data in two different cell models (Daoy and CHLA-266) upon HHIP-AS1 knockdown (using sh-HHIP-AS1#1 and sh-HHIP-AS1#2) versus control cells (sh-scr, n = 3 independent samples per condition and cell model). b Scatter plot displaying expression correlation of DYNC1I2 and HHIP-AS1 sequencing data comparing FPKM expression values in 167 MB patient samples. Samples are color coded for MB subgroups. Statistics were done by Pearson correlation. c Representative image of co-localization of HHIP-AS1 and DYNC1I2 mRNA in Daoy obtained through two-color fluorescence in situ hybridization (FISH). White frame indicates the location of the zoom out picture at the right side. Green: HHIP-AS1 lncRNA, red: DYNC1I2 mRNA, blue: DAPI, Nucleus. Scale bar: 5 µm. This experiment was repeated twice with similar results. d Enrichment of DYNC1I2 mRNA upon HHIP-AS1 raPOOL pulldown in Daoy and CHLA-266 cell lines and HHU-ATRT1 primary cells. Bar graphs are presented as the mean ± SD of three independent experiments. e Bio-Layer interferometry was used for detecting direct interaction between DYNC1I2 mRNA and HHIP-AS1. f DYNC1I2 mRNA stability upon transfection of a control (HHIP-AS1neg) or the HHIP-AS1 interacting sequence (HHIP-AS1bind). Calculation was done in comparison to the mRNA level at time point “0 h” in each condition. Data are presented as the mean ± SEM of five independent experiments; Student´s two-sided t-test; *p < 0.05. g Bar graph indicating the proliferation rate or viability of Daoy cells in control condition (Ctrl), upon overexpression of DYNC1I2 (DYNC1I2 OE) and upon transient HHIP-AS1-knockdown (si-HHIP-AS1) in DYNC1I2 overexpression (DYNC1I2 OE + si-HHIP-AS1). Data are represented as the mean ± SD of at least six independent experiments normalized to the control condition. Student’s two-sided t-test; ***p < 0.001; n.s. not significant. h The immunoblot shows a representative blot of DYNC1I2 protein expression in control (Ctrl) or DYNC1I2-overexpressing (DYNC1I2 OE) cells. ACTB immunoblotting was used as loading control. This experiment was done twice with similar result. Source data and exact p-values are provided as a “Source Data file”.

