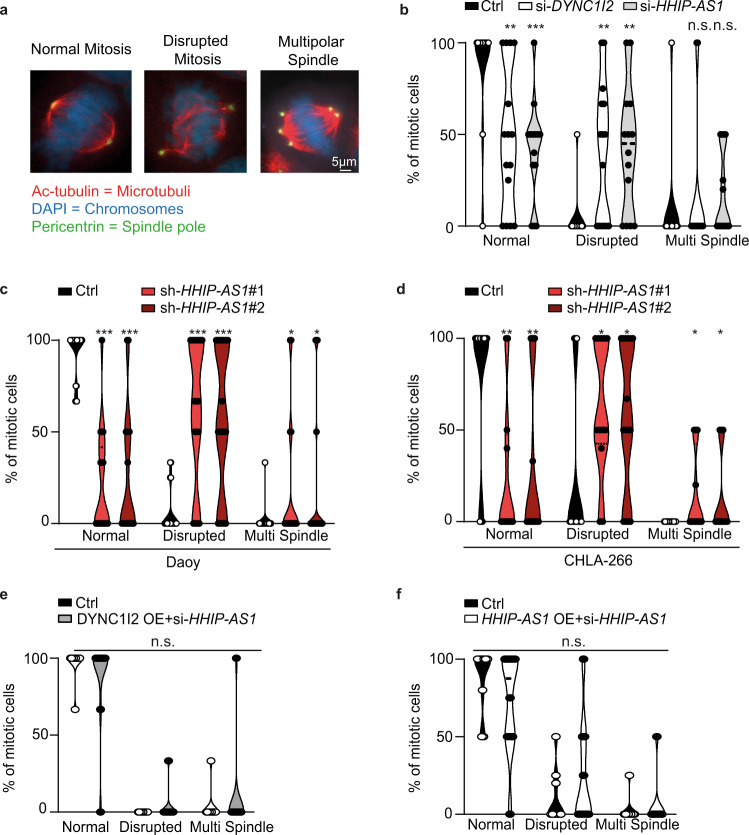
Fig. 4. The interaction between HHIP-AS1 and DYNC1I2 promotes mitosis.
a Representative images of immunofluorescence analysis show spindle assembly in mitotic cells by immunostaining for acetylated tubulin (Ac-tubulin, red) and pericentrin (green). Chromosomes are visualized with DAPI (blue). White scale bar: 5 μm. b–d Bar graphs display the percentage of dividing cells displaying normal, disrupted or multipolar spindle mitosis under control (Ctrl = si-negative-POOL or sh-scr) condition and DYNC1I2- or HHIP-AS1-knockdown using siRNAs for transient knockdown in Daoy (b) or two independent shRNAs (sh-HHIP-AS1#1 and sh-HHIP-AS1#2) for stable HHIP-AS1 knockdown in Daoy (c) and in CHLA-266 (d). e Bar graphs showing the percentage of dividing cells displaying normal, disrupted or multipolar spindle mitosis under control (Ctrl) condition or upon rescue of DYNC1I2 expression by endogenous gene transcriptional activation through CRISPR-Cas9 technology in the context of transient HHIP-AS1 knockdown (DYNC1I2 OE + si-HHIP-AS1) in Daoy cells. f Bar graphs showing the percentage of dividing cells displaying normal, disrupted or multipolar spindle mitosis under control (Ctrl) condition or upon rescue of HHIP-AS1 expression by endogenous gene transcriptional activation through CRISPR-Cas9 technology in the context of transient HHIP-AS1 knockdown (HHIP-AS1 OE + si-HHIP-AS1) in Daoy cells. All bar graph values are representative of n at least ten independent experiments (with a total n > 50 counted mitotic cells) and data are shown as mean ± SEM. Student’s two-sided t-test; ***p < 0.001; **p < 0.01; *p < 0.05; n.s. not significant. Source data and exact p-values are provided as a “Source Data file”.

