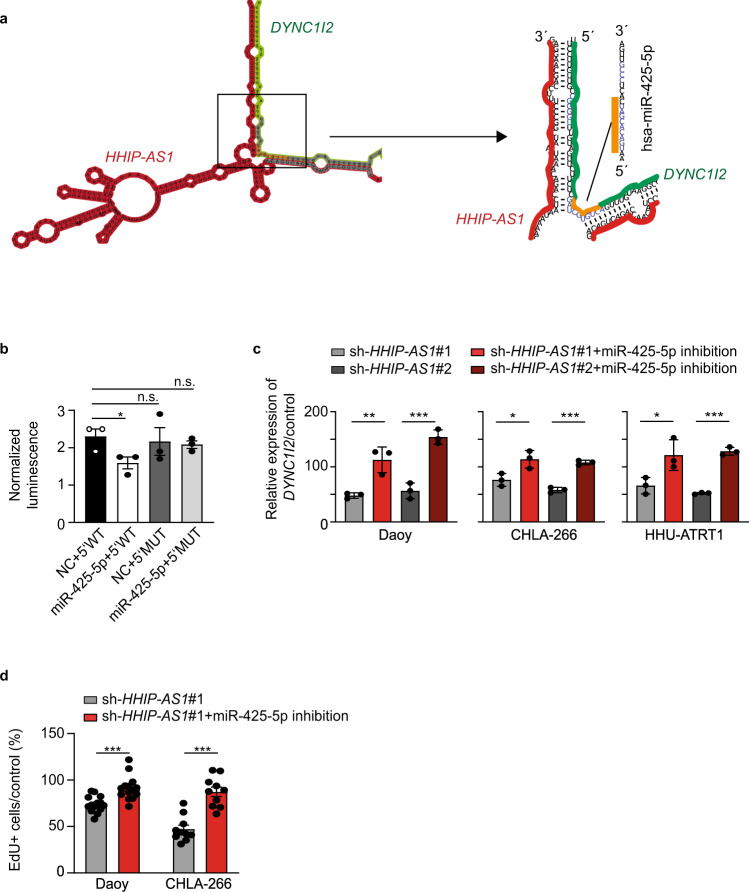
Fig. 5. HHIP-AS1 blocks endogenous hsa-miR-425-5p function to maintain DYNC1I2 levels.
a Schematic view of the complex structure generated by the predicted base-pairing interaction between HHIP-AS1 (red) and the 5'UTR of DYNC1I2 mRNA (green). The sequence of hsa-miR-425-5p is also shown and the inferred binding site of this miRNA on DYNC1I2 mRNA 5'UTR is depicted in orange. The scheme highlights how this miRNA-mRNA interaction is predicted to be blocked by HHIP-AS1 association to DYNC1I2 mRNA. Black frame indicates position for zoom out image on the right side. b The wild type 5'UTR of DYNC1I2 mRNA (5'WT) or a mutated version (5'MUT) were cloned in front of a luciferase coding sequence and co-transfected in combination with hsa-miR-425-5p mimics (mir-425) or negative controls (NC) into Daoy cells. Bar graphs indicate the measured relative luciferase activity for each combination ± SEM in three independent experiments. Student’s one-sided t-test; *p < 0.05. n.s. not significant. c DYNC1I2 expression level was measured via qRT-PCR in Daoy, CHLA-266 and HHU-ATRT1 cells upon stable HHIP-AS1 knockdown using two independent stable shRNAs (sh-HHIP-AS1#1 and sh-HHIP-AS1#2), in combination with or without transient inhibition of hsa-miR-425-5p. Bar graphs are presented as the mean ± SD of three independent experiments. d Proliferation rate of Daoy and CHLA-266 with stable knockdown of HHIP-AS1 (sh-HHIP-AS1#1) measured by EdU incorporation in combination with or without transient inhibition of hsa-miR-425-5p. Bar graphs are presented as the mean ± SEM of at least ten independent experiments and corresponding controls were set to 100%. Student’s two-sided t-test; ***p < 0.001; **p < 0.01; *p < 0.05; n.s. not significant. Source data and exact p-values are provided as a “Source Data file”.

