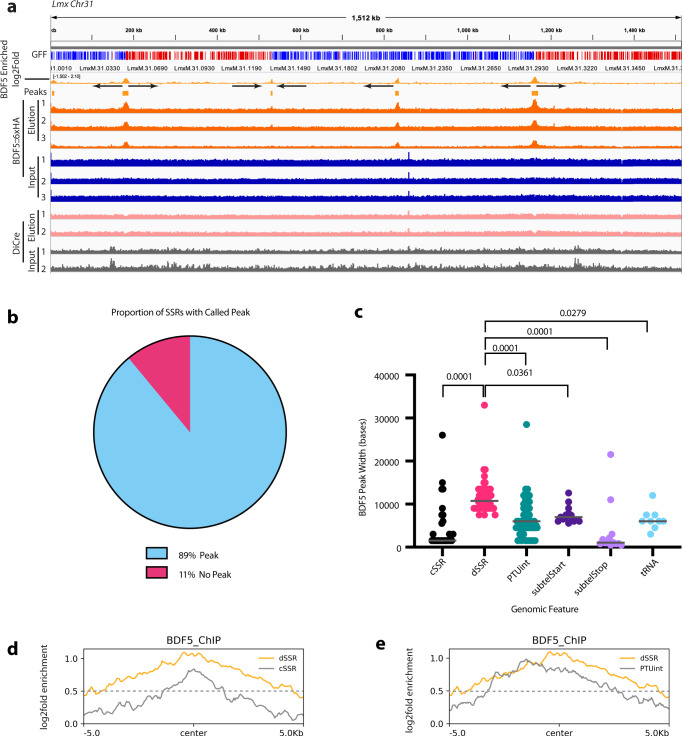
Fig. 4. ChIP-seq analysis of BDF5 distribution on chromatin.
a IGV genome browser view using chromosome 31 as an example, indicating the genes in polycistronic transcription units (colour and arrow coded by direction), the read depth for input and eluted sample of the ChIP-seq of BDF5−/+flx (N = 3) and the enrichment of DNA associated with BDF5::6xHA on a log2 fold scale, GFF (gene feature file) indicates gene CDS coloured by strand (red + , blue-). Control ChIP-seqs were performed for the DiCre strain which does not contain a HA-tagged protein and input (grey tracks) and eluted (pink tracks) samples are represented below (N = 2). Peaks were defined as regions being >0.5 log2fold enriched in the elution versus input. b Pie chart indicating the proportion of SSRs with a BDF5-enriched peak. c BDF5 peak size at different genomic regions, cSSR (convergent strand switch region, n = 28), dSSR (divergent strand switch region, n = 54), PTUint (internal PTU peak, n = 52), subtelStart (subtelomeric peak consistent with PTU transcriptional start, n = 15), subtelStop (subtelomeric peak consistent with PTU transcriptional stop, n = 13), tRNA (tRNA gene located away from any of the other features, n = 9). Values above denote p-value from Kruskal–Wallace test to compare samples. d Metaplot of average BDF5 fold enrichment at dSSR (n = 60) and cSSR (n = 40) regions. e Metaplot of BDF5 average BDF5 fold enrichment at dSSR (n = 60) and PTU internal peaks (n = 56).

