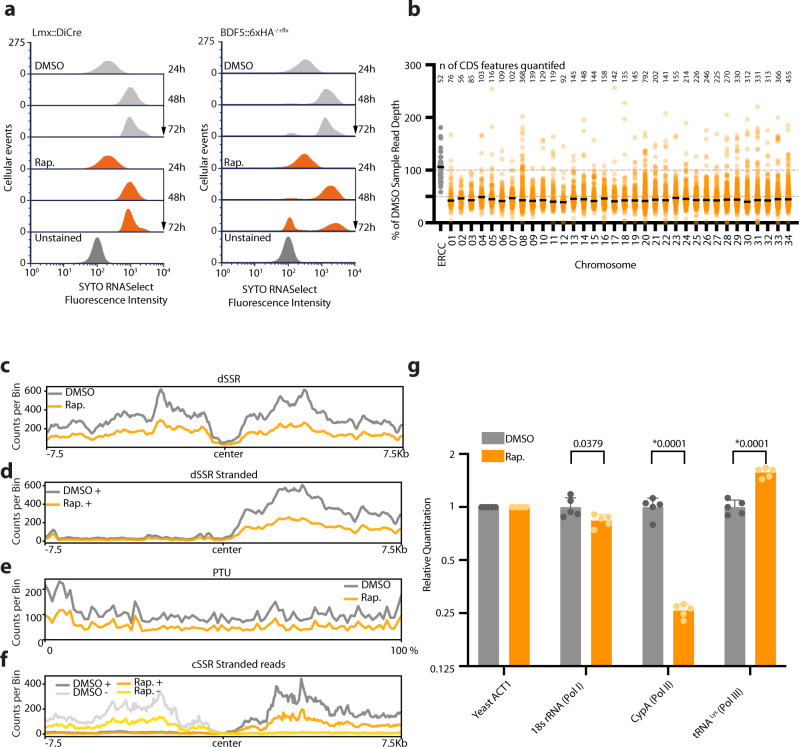
Fig. 6. Effect of BDF5 depletion on RNA levels and gene expression.
a Flow cytometry of cells stained with SYTO RNASelect Stain to measure total RNA levels in Lmx::DiCre strains or the BDF5−/+flx strain treated with rapamycin or DMSO over a 72 h time course. 20,000 events measured per condition. b Dot plot of total RNA-seq reads per protein-coding gene scaled to ERCC spike-in controls, then as a percentage of the DMSO control sample, separated per chromosome, conducted at a 96 h timepoint. Black lines denote the median of the scaled response for each chromosome, individual data points are means of 2 separate RNA seq experiments, the number of CDS features quantified on each chromosome is indicated above the dot plots. c Metaplot of divergent SSR (n = 60) for DMSO treated or rapamycin-treated BDF5−/+flx showing combined reads from the positive and negative strands. d. Metaplot of reads mapping to the + strand, normalised to ERCC control at divergent SSRs (n = 60) of DMSO treated or rapamycin-treated BDF5−/+flx cultures. e Metaplot of + stranded RNA-seq reads normalised to ERCC spike-in controls for PTUs (n = 120), on a scale of 0–100%. f. Metaplot of reads mapping to the + and − strands, normalised to ERCC control at convergent SSRs (n = 40) of DMSO treated or rapamycin-treated BDF5−/+flx cultures. Metaplot data is from 1 representative of the three replicate RNA-seq datasets. g Spike-in controlled SYBR RT-qPCR of reporter genes for Pol I, II, III. BDF5 deletion was induced for 96 h and total RNA was extracted with lysis buffer spiked with yeast total RNA to provide a normalisation channel using a primer set against yeast actin, allowing comparison of the relative 18s rRNA, Cyclophilin A, and tRNALys RNA levels compared to DMSO treated cells. Bars denote mean, error bars denote standard deviation. Comparisons by multiple two-sided t test, corrected with Benjamini and Hochberg method, p-values indicate above, * denotes a discovery, n = 5 replicate PCR reactions. ACT1 values were not compared as this was the normalisation target.

