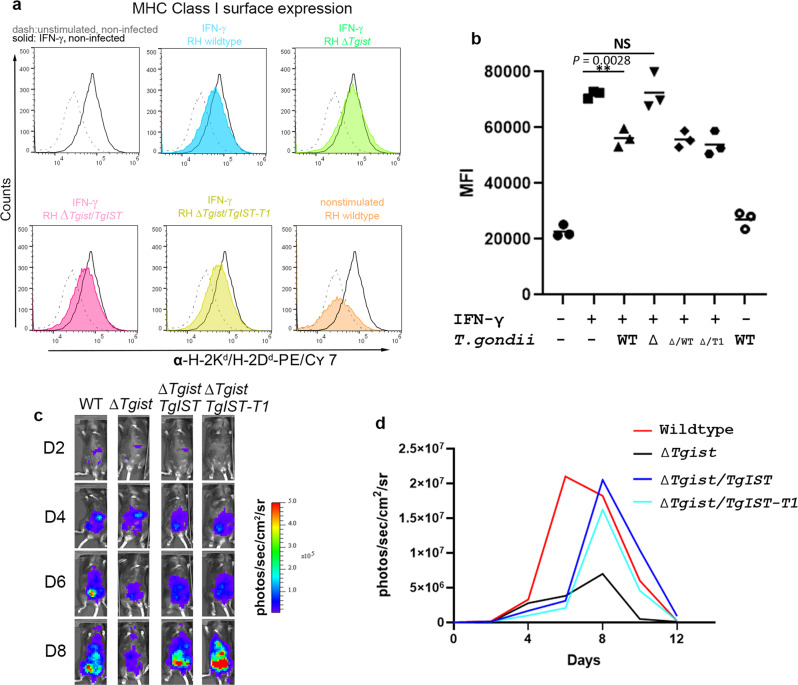
Fig. 3. The TgIST repeats are sufficient to block IFN-γ signaling and promote parasites dissemination in vivo.
a Surface expression of MHC I on RAW264.7 macrophage cells by flow cytometry. RAW264.7 macrophages were infected with T. gondii for 6 h at a MOI = 3:1. Comparison of RH wild type, ∆Tgist mutant, and complemented lines expressing full length (RH∆Tgist/TgIST) or a truncated version that binds STAT1 but not Mi2/NuRD (RH∆Tgist/TgIST-T1). Expression of MHC I molecules I-A/I-E was measured on non-stimulated and IFN-γ stimulated RAW264.7 18 h after infection. Histograms show representative results of three independent experiments. b Median fluorescence intensities (MFI) were calculated from each of three independent experiments in (a). **P = 0.0028 with one-way ANOVA by Dunnett’s test for multiple comparisons. c Comparison of C57/BL6 mice infected with firefly luciferase-expressing parasites. Comparison of Pru wild type, ∆Tgist mutant, and complemented lines expressing full length (∆Tgist/TgIST) or truncated version that binds STAT1 but not NuRD (∆Tgist/TgIST-T1). Bioluminescence was imaged with an in vivo imaging system from day 0 to 12 after the i.p. of 1000 tachyzoites. Representative mice from each group are shown at different days (D2, D4, D6, D8) post infection. Representative image of one mouse among five mice in each group are shown here. d Comparison of C57/BL6 mice infected with firefly luciferase-expressing wild-type and mutant parasites. The graph depicts mean whole-animal radiance from one experiment with five female mice in each group. The mouse with the lowest and highest intensity were excluded in each group. Source data are provided in the Source Data file.

