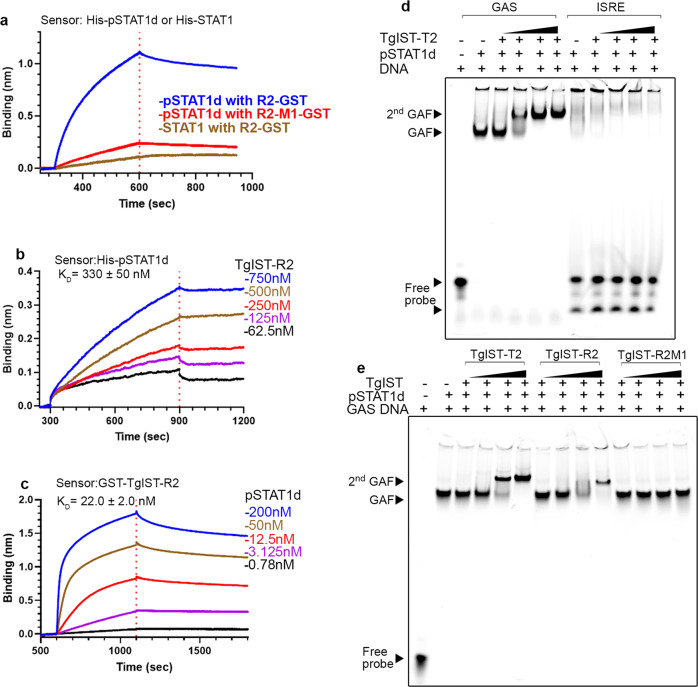
Fig. 4. The repeat region of TgIST binds phosphorylated STAT1 dimers complexed with DNA.
a BLI sensorgrams obtained using biosensor loaded with His-tagged pSTAT1 dimer (pSTAT1d, 10 µg/mL) and incubated with 200 µM TgIST-R2 (R2-GST) or TgIST-R2-M1 (R2-GST-M1). The red dashed line separates the binding (left) and dissociation (right) phase. The binding of STAT1 monomer to TgIST-R2 (R2-GST) is shown in tan. b BLI sensorgrams using His-tagged recombinant phosphorylated STAT1 dimer (pSTAT1d) immobilized onto Ni-NTA biosensors, followed by incubation in various concentrations of TgIST-R2 after removal of the GST tag. Binding phase (left of the red dotted line) and dissociation phase (right of the red dotted line). c BLI sensorgrams using biosensor loaded with recombinant GST-tagged GST-TgIST-R2 and interacted with different concentrations of pSTAT1d. Binding phase (left of the dotted red line) and dissociation phase (right of the red dotted line). d Electromobility shift assays (EMSA) demonstrating TgIST-T2 binds to pSTAT1d associated with GAS DNA oligonucleotide but not to ISRE oligonucleotide. See also Supplementary Fig. 7 for unlabeled competitor assays. Purified pSTAT1 dimer was incubated with far-red fluorescence IRDye labeled double-stranded oligonucleotides, purified TgIST-T2 was then added, followed by a native polyacrylamide gel analysis. Visualization was performed using an Odyssey infrared imager. GAF refers to gamma-interferon activation factor composed of pSTAT1 and the labeled GAS DNA probe, 2nd GAF refers to GAF further complexed with TgIST-T2 resulting in a higher molecular weight complex. Black triangles indicate increasing concentration of TgIST-T2. e Formation of the 2nd GAF complex is dependent on the repeats in TgIST-R2. STAT1 dimer and GAS oligonucleotide complexes were made as in (d) but in addition to the T2 construct (TgIST-T2), GST-tagged TgIST-R2, or the mutated version TgIST-R2-M1, were also tested. GST was used as the affinity tag for purification and to increase the molecular weight in of TgIST-R2 to visualize R2-mediated super shift. See Supplementary Fig. 7 for GST alone control. Black triangles indicate increasing concentration of components added based on label at the top. Representative gel image (d, e) of two independent experiments with similar results were shown here. Source data are provided in the Source Data file.

