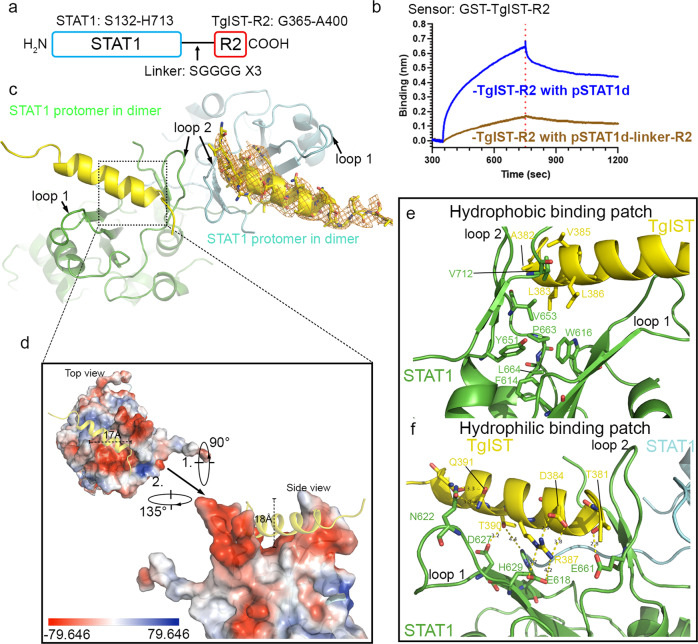
Fig. 5. Molecular interactions between TgIST-R2 and STAT1 dimer revealed by structural studies.
a Schematic diagram of the STAT1-linker-R2 fusion protein (STAT1-TgIST-R2). The arrow indicates the flexible peptide linker. b BLI sensorgrams using biosensor loaded with recombinant GST-TgIST-R2 and interacted with pSTAT1d or pSTAT1d-linker-R2, both at 50 nM concentration. c Crystal structure of TgIST-R2 with STAT1 dimer based on the fused peptide construct shown in (c). The peptide backbones of two STAT1 protomers within the dimer are shown in cyan and green loops while the TgIST peptide is shown in yellow ribbon. Orange mesh represents the 2Fo-Fc map of TgIST-R2 contoured at 1.5 σ. d Electrostatic potential surface representation of the TgIST binding region in STAT1. e, f Direct interactions between TgIST-R2 and STAT1 at the binding interface. The yellow dashed lines indicate salt bridges or hydrogen bonds between corresponding atoms within 2.8–4.2 Å, with the exception of the 4.4 Å between TgIST-T390 and STAT1-H629. Source data are provided in the Source Data file.

