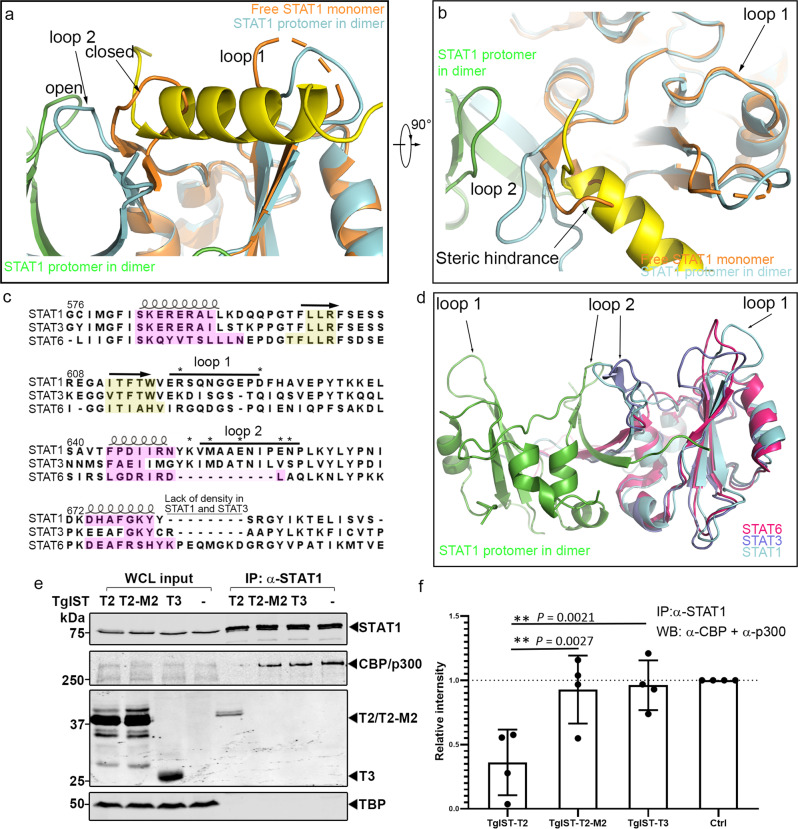
Fig. 7. TgIST binding to the STAT1 dimer interface blocks recruitment of co-transcription factors CBP/p300.
a, b Structural superimposition of pSTAT1-TgIST-R2 complex and the free monomeric STAT1 (orange, PDB: 1YVL) showing steric hinderance at the SH2 domain. TgIST-R2-bound structure of pSTAT1 is shown for comparison with loop 2 in the open conformation (ycan). These features are conserved across species (see Supplementary Fig. 10). c Structure-based sequence alignment of the SH2 domains of phosphorylated STAT1, STAT3, and STAT6 dimers. Secondary structures are indicated using loops or arrows for α-helix and β-sheet, respectively. The yellow or magenta highlighted amino acids represent conserved secondary structures defined by the DALI server. Asterisks indicate residues that lost binding to TgIST-T2 when mutated in STAT1. d Structural superimposition of STAT1 (cyan, green), STAT3 dimer (purple, PDB: 1BG1), and STAT6 dimer (red, PDB: 5D39) highlighting differences in loop 2. e Western blot analysis of STAT1 immunoprecipitation (IP) from TgIST transfected HEK293T cells. Cells were transfected with plasmids expressing different TgIST domains: TgIST-T2 (T2) containing two STAT1-binding repeats; TgIST-T2-M2 (M2) containing mutated STAT1-binding repeats; TgIST-T3 (T3) lacking the two repeats (see Figs. 1d and 2e). Cells were grown for 23 h, then treated ±IFN-γ (100 U/mL) for an additional 60 min prior to whole-cell extract preparation. Membranes were incubated with corresponding primary antibodies as indicated and then IR dye-conjugated secondary antibodies. Visualization was performed using an Odyssey infrared imager. f Quantification and statistics of the CBP/p300 band intensities in (e). Intensities of the bands corresponding to CBP/p300 were measured by Image Studio then relative intensity was adjusted to CBP/p300 intensity in the mock transfect lane. Shapiro-Wilk test for normality; **P = exact values shown as determined with two-way ANOVA by Dunnett’s test for multiple comparisons. Data presented as mean ± s.d. from four independent experiments. Source data are provided in the Source Data file.

