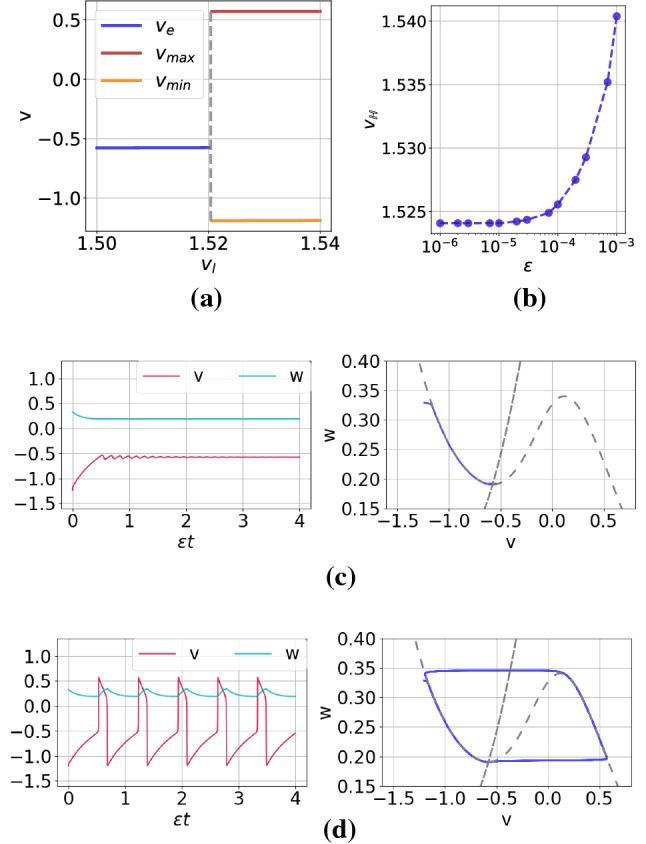
Fig. 2.

Panel a: Bifurcation diagram of a single isolated ML neuron without autapses against the excitability parameter at a fixed timescale separation parameter . The Hopf bifurcation value separating the excitable regime (blue line) and oscillatory regime (orange line) is indicated by the dashed-gray vertical line located at . Panel b: Variation of the Hopf bifurcation value with the timescale parameter . To avoid oscillatory regime due to Hopf bifurcation, we fixed in all simulations. Panels c and d show, each, a time series (left) and the associated phase portrait (right) of a trajectory in the excitable regime and in the oscillatory regime , respectively. (Color figure online)
