Fig. 9.

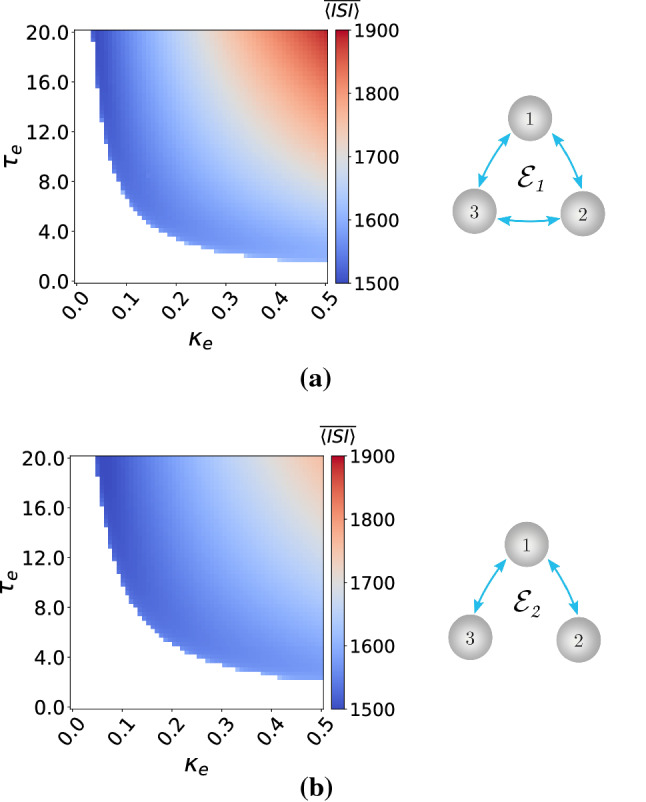
Excitability maps (left) and corresponding topology (right) of electrically coupled motif layer networks. is color coded with the white region representing the excitable regime and the colored regions the oscillatory regimes. ,

Excitability maps (left) and corresponding topology (right) of electrically coupled motif layer networks. is color coded with the white region representing the excitable regime and the colored regions the oscillatory regimes. ,