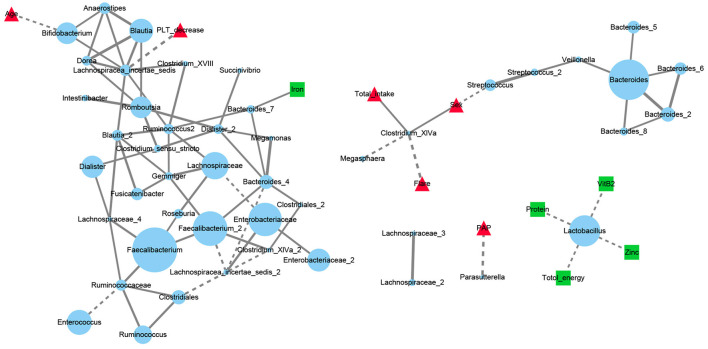
Figure 5.
Network analysis of dietary elements, gut microbiota and manifestations of SLE patients. Each blue dot represented for an OTU and its diameter was proportional to the square root of its abundance. Red triangles represented for disease manifestations and green squares for dietary factors. Solid line represented for the significant positive correlations (Spearman r > 0 and FDR adjusted p < 0.05) and dashed for negative correlations (Spearman r <0 and FDR adjusted p < 0.05). PLT, platelets; Flare: the state of SLE disease flare; PAP, pulmonary artery pressure.

