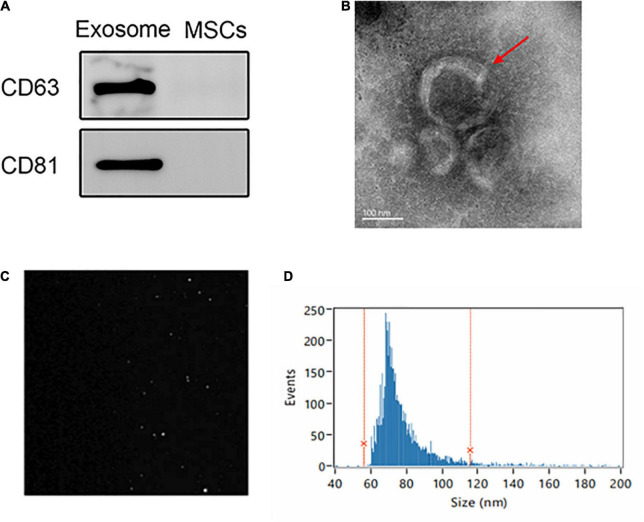
FIGURE 2.
Extraction and identification of UC-MSC-Exo. (A) Expression of exosome markers (CD63 and CD81) examined by western blot analysis. (B) Representative images showing the morphology of UC-MSC-Exo by transmission electron microscopy. Scale bar = 100 nm. (C) The Brownian movement of the UC-MSC-Exo. (D) NTA analysis demonstrating the diameter of exosomes which ranged from 56.07 to 115.71 nm, with a mean diameter of 75.66 nm.

