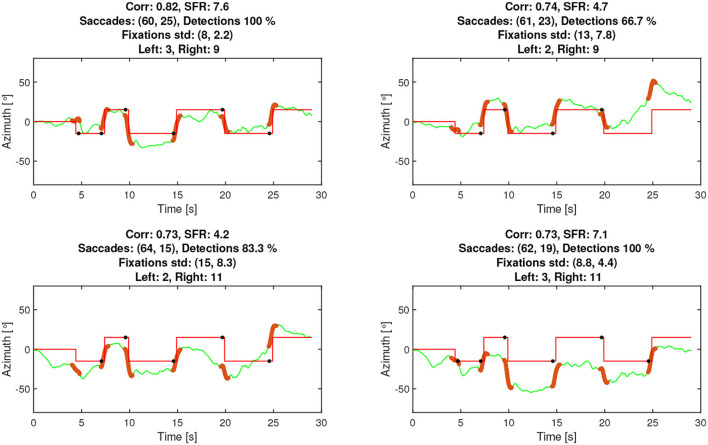
Figure 7.
Example of attended speaker estimation data from a trial with participant TP1743. The solid red line represents gaze in degrees from the eye-tracker, the dashed blue line is the in-ear EOG signal, which is scaled for illustration purposes, the yellow and green asterisks are the eye-tracker-attended speakers while the black and magenta small dots are the in-ear EOG-attended speakers. Values below and above 0 deg. refer to left- and right-hand speakers, respectively.

