FIGURE 7.

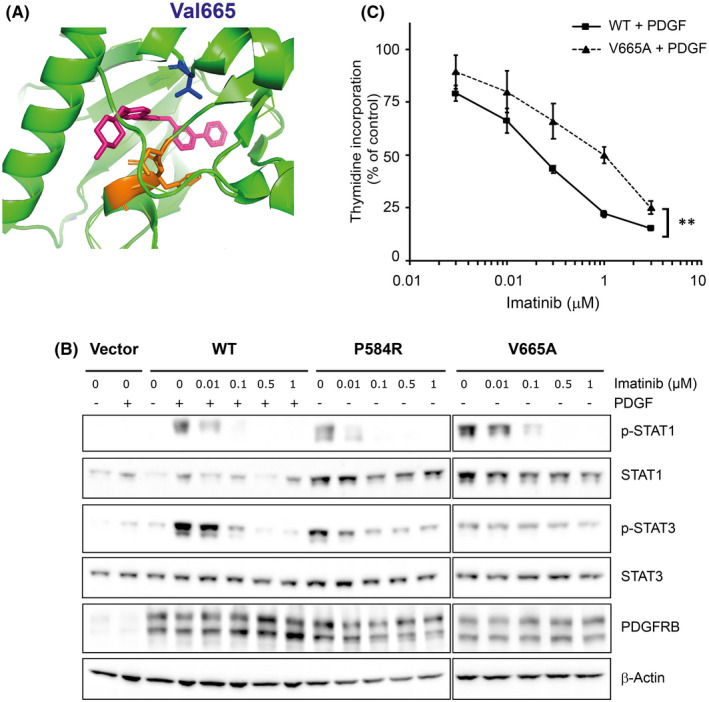
p.V665A mutation decreases the sensitivity to imatinib. (A) Position equivalent to valine 665 (blue), in the catalytic cleft of the PDGFRA kinase domain (green) co‐crystalized with imatinib (pink). The Asp‐Phe‐Gly (DFG) motif, which plays an important role in the regulation of kinase activity, is shown in orange. The alpha‐C helix is on the left. Drawn using PyMol based on structure #6JOL from Protein Data Bank. (B) NIH3T3 cell lines expressing the indicated receptor were produced as shown in Figure 3. Cells were starved for 4 h and treated with different concentrations of imatinib as indicated. As a positive control, cells expressing the WT receptor were stimulated with PDGF‐BB for 15 min. The total lysates were analysed by Western blotting. (C) Ba/F3 cells expressing WT PDGFRB or βV665A were produced as described in Figure 2. Cells were stimulated with PDGF‐BB for 24 h in the presence of the indicated concentration of imatinib. Four hours before harvest, [3H]‐thymidine was added to each well. Radiolabelled thymidine incorporation was quantified and compared to cells that were not treated with imatinib. The average of three independent experiments is shown with SEM and statistical analysis (anova test, p < 0.01)
