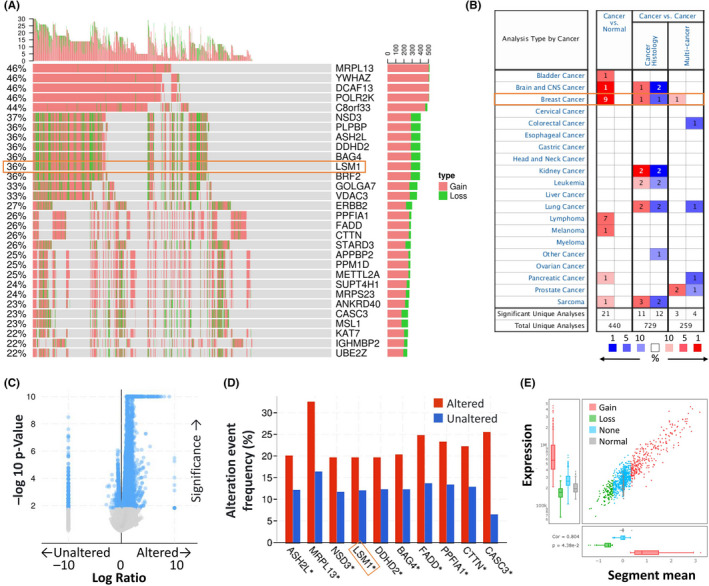
FIGURE 1.

LSM was significantly overexpressed in breast cancer compared with normal breast tissue. (A) Waterfall plot illustrates the relations between the top 30 genes and the CNV in cancer patients for a specific breast cancer. (B) The mRNA expression levels of LSM1 in multiple cancers on ONCOMINE database. Transcriptional expression of LSM1 was significantly high in breast cancer. (C) Volcano plots exhibiting genes associated with alterations in LSM1 CNA frequency. (D) The top 10 genes with the highest alteration frequencies were markedly enriched in the altered group. (E) The distribution and correlation of CNV in breast cancer were marked with red (gain) and green (loss) to visualize the distribution of log2 ratios
