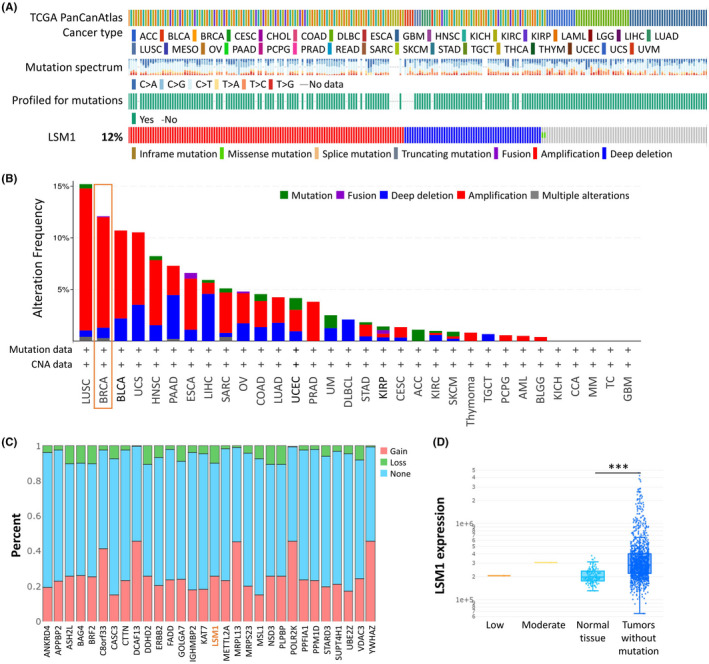
FIGURE 2.

LSM1‐related transcription factor alternation analysis in breast cancer. (A) LSM1 gene mutation frequencies and types in breast cancer samples. (B) Genetic alterations of LSM1 gene in various cancer types using cBioPortal cancer genomics analysis. (C) Gene mutation frequencies of LSM1 in various carcinoma types. The red bars indicate gene amplifications, blue bars are homozygous deletions, green bars are non‐synonymous mutations, and grey bars indicate multiple alterations. (D) The expression of LSM1 in different types of mutant tumour tissues (n = 990). ***p < 0.001
