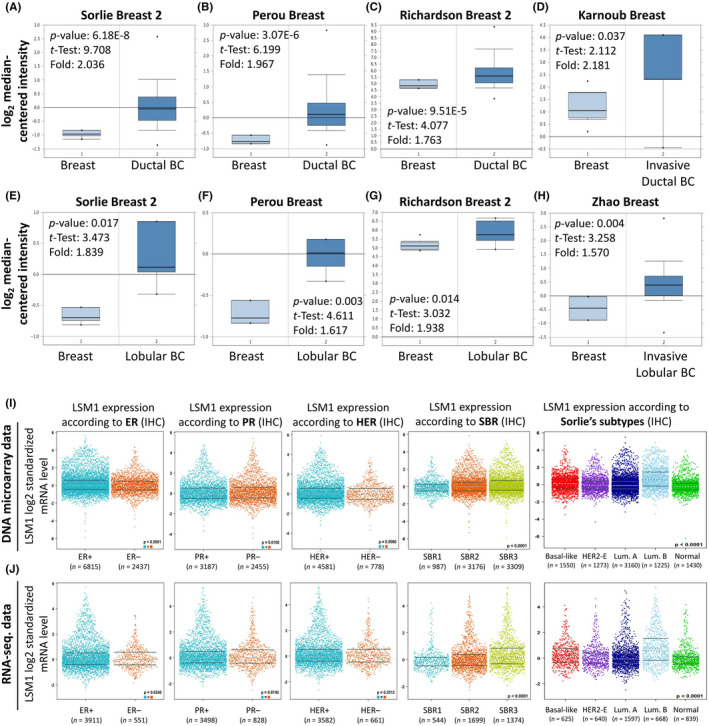
FIGURE 5.

Box and whiskers plots and differential expression of in breast cancer patients based on different kinds of classified parameters. LSM1 mRNA levels from (A and E) Sorlie Breast 2 Statistics cohort, (B and F) Perou Breast Statistics cohort, (C and G) Richardson Breast 2 Statistics cohort, (D) Karnoub Breast Statistics cohort, (H) Zhao Breast Statistics cohort in BRCA and normal tissue. Note: p < 0.05 indicates statistical significance; LSM1 was among the top 10% overexpressed genes in all five different datasets of BRCA. (I and J) LSM1 mRNA expression levels were shown in breast cancer patients by bee swarm in DNA microarray datasets and RNA‐sequencing datasets. (ER, oestrogen receptor; PR, progesterone receptor; HER2, human epidermal growth factor receptor 2)
