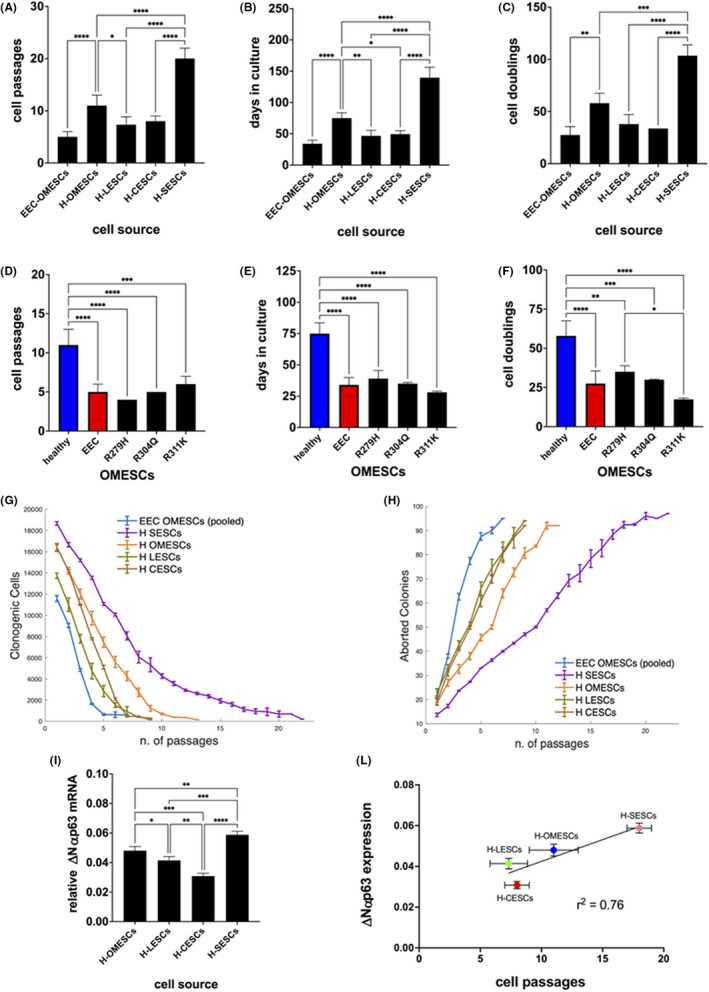
FIGURE 2.

Proliferative potential of epithelial stem cells from different sources in vitro. (A) Cell passages, (B) days in culture and (C) cell doublings of EEC‐OMESCs, H‐OMESCs, H‐LESCs, H‐CESCs and H‐SESCs. (D) Cell passages, (E) days in culture and (F) cell doublings of healthy (blue) and EEC (red) OMESCs. EEC stands for the average of the values found for the three mutants R279H, R304Q and R311K OMESCs. (G) Clonogenic cell number and (H) percentage of aborted colonies relative to ESCs obtained from the indicated sources. For statistical analysis calculated by ONE way anova, please refer to Figure S1A,B. (I) Real‐time quantitative analysis of ∆Np63α expression in H‐OMESCs, H‐SESCs, H‐LESCs and H‐CESCs. Results are normalized against GAPDH. Data shown are mean + standard deviation of the mean along with the results of statistical significance as calculated by ordinary One‐Way anova with multiple comparisons (*p < .05; **p < .005; ***p < .0005; ****p < .0001). (L) The ∆Np63α expression levels of each individual ESC are plotted against the number of passages in culture. Mean values ± standard error of the means are shown, along with the chi‐squared value calculated for the linear regression. SESCs, skin epithelial stem cells; OMESCs, oral mucosa epithelial stem cells; LESCs, limbal epithelial stem cells; CESCs, conjunctival epithelial stem cells; GAPDH, glyceraldehyde 3‐phosphate dehydrogenase
