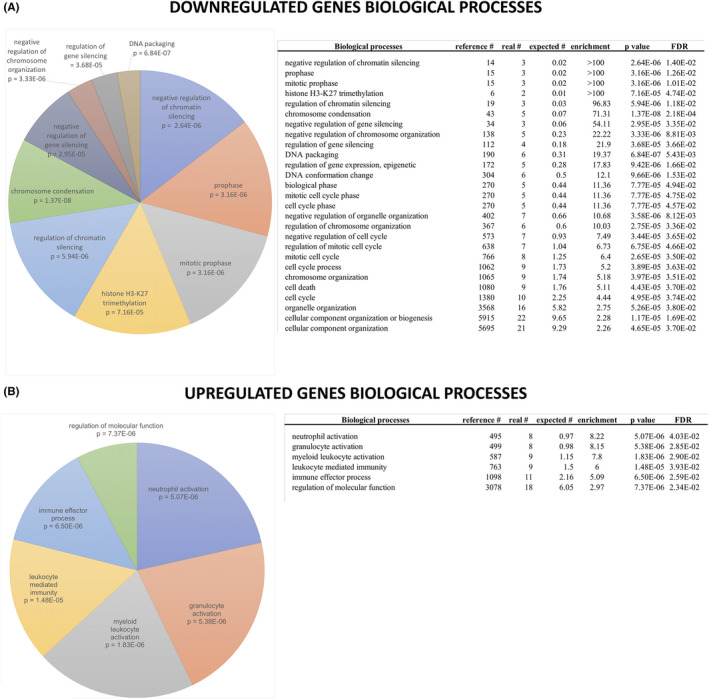
FIGURE 7.

Gene ontology (GO) enrichment analysis of deregulated genes in epithelial SCs. Genes either down‐regulated (A) or up‐regulated (B) during SC lifespans were used to perform GO enrichment analysis as described in the materials and methods section. All significantly enriched biological processes are shown on the left: the size of each slice is proportional to the enrichment of each biological process with respect to the reference list, and the p value is indicated. All other relevant information is reported in the right panels
