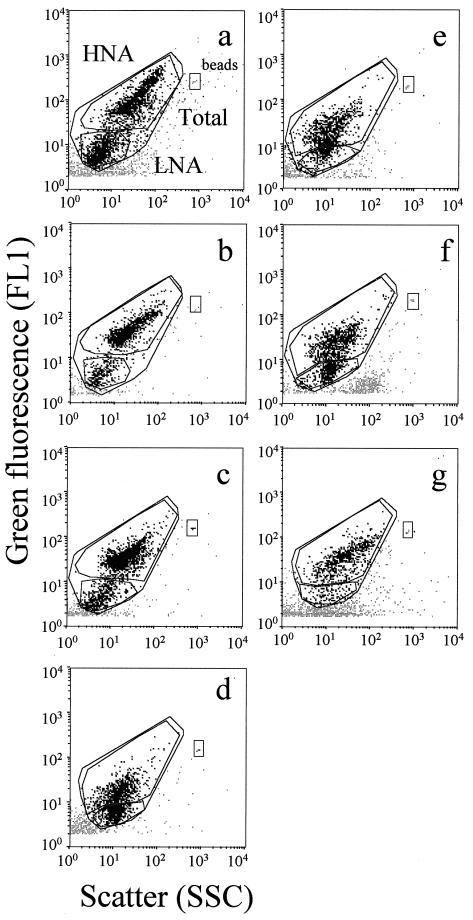
FIG. 2.
Flow cytometric analysis of water samples collected in the Tech River, including samples Tech 1 (a), Tech 2 (b), and Tech 3 (c); in the Leucate Lagoon (d); at the SOLA station, including samples SOLA 1 (e) and SOLA 2 (f); and in the Banyuls-sur-Mer harbor (g). HNA and LNA cells are delimited by windows on each cytogram.

