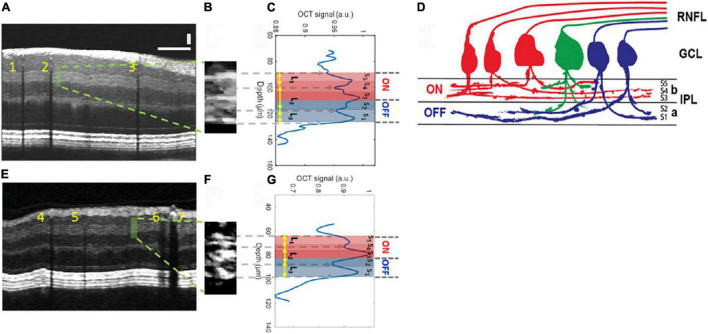
FIGURE 2.
Inner plexiform layer (IPL) sublayer visualization with Vis-OCT. (A) A speckle-reduced vis-OCT image from a healthy eye. A horizontal bar: 500 μ m; a vertical bar: 50 μ m. (B) A magnified view of the region highlighted by the dashed box in (A) (15 srA-lines segments). (C) A depth-resolved OCT amplitude profile of the IPL sublayers. We averaged 15 srA-lines, corresponding to approximately 88 μ m along the lateral direction within the highlighted region in (A). (D) Illustration of the lamination of ganglion cells from RNFL to the IPL. The “red” ganglion cells (ON center) are laminating dendrites to the “b” sublamella of the IPL whereas “blue” cells (OFF center) laminate to the “a” sublamella. The “green” ganglion cell is bi-laminating. (E) A speckle-reduced vis-OCT image from a glaucoma eye. (F) A magnified view of the region highlighted by the dashed box in (E). (G) A depth-resolved line profile of the glaucoma eye IPL sublayers. This figure was reprinted from Ghassabi et al. (113) with permission under a Creative Commons Attribution 4.0 International License.

