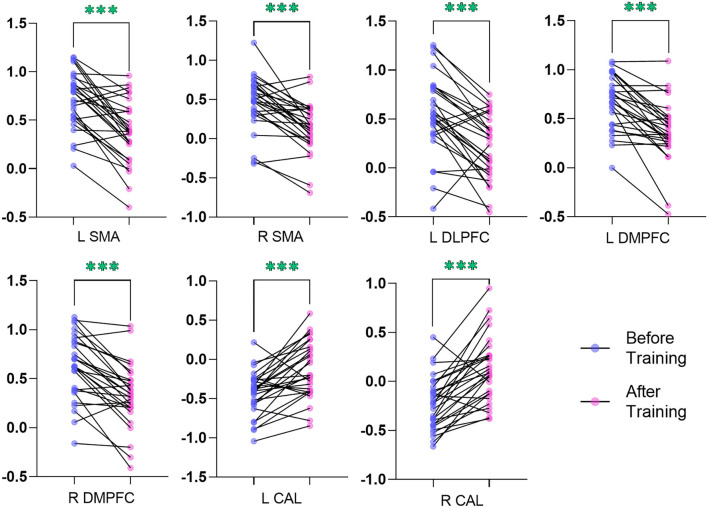
Figure 3.
Plot of the z-transform ReHo values in brain regions that exhibited altered ReHo. The blue dots (before training condition) and the pink dots (after training condition) indicated the mean values of ReHo in the different brain regions of all the subjects. L, left; R, right; ReHo, regional homogeneity; SMA, supplementary motor area; DLPFC, dorsal lateral pre-frontal cortex; DMPFC, dorsal medial pre-frontal cortex; CAL, cerebellum anterior lobe. ***indicates p < .001.

