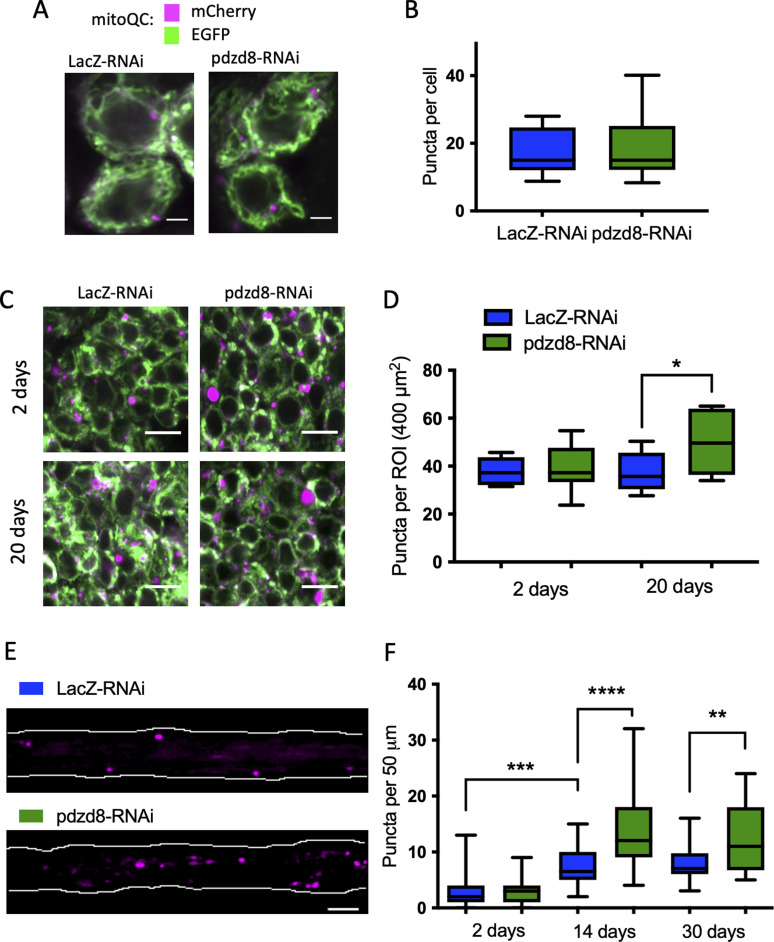
Figure 5. Pan-neuronal pdzd8-RNAi increases mitophagy during aging.
(A) Representative images of MitoQC signal in wandering L3 larval ventral ganglia. magenta = mCherry, green = GFP, images show a single plane of a Z stack. Scale bar = 2 μm. (A, B) Quantification of MitoQC puncta shown in (A), n = 9 ROIs, differences ns. (C) Representative images of MitoQC signal in adult brains in 2- and 20-d-old flies, magenta = mCherry, green = GFP. Scale bar = 5 μm, image shows a single plane of a Z stack. (D, E) Quantification of MitoQC signal in adult brains and compared using an unpaired t test with Welch’s correction (n = 7–9 ROIs, P = 0.0072) (E) the Representative images of MitoQC signal in 14-d-old fly wings. Only mCherry signal (magenta) is shown for clarity. Wing nerve are outlined (white). Scale bar = 5 μm. (F) Quantification of MitoQC signal in aged fly wings at 2, 14, and 30 d post-eclosion using a one-way ANOVA with Holm–Sidak’s multiple comparisons. n (2 d) = 33, 26 wings (14 d) = 24, 31 wings (30 d) = 32, 12 wings. **P < 0.01, ***P < 0.001, ****P < 0.0001.

