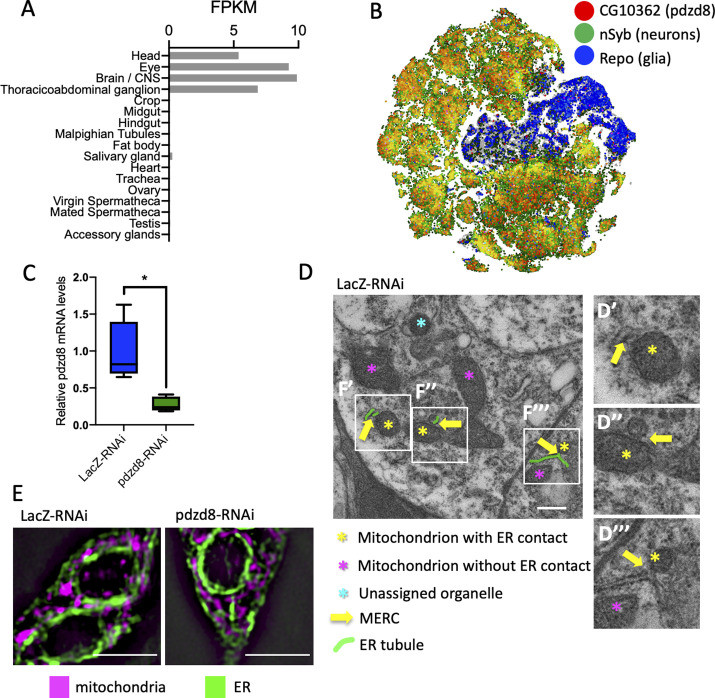
Figure S1. Expression and tissue specificity of pdzd8.
(A) Tissue-specific expression of pdzd8 in 7-d-old adult males from Leader et al (2018). FPKM, fragments per kilobase of exon model per million reads mapped providing a normalized estimation of gene expression based on RNA-seq data. (B) SCope transcriptome data from the unfiltered adult fly brain dataset. (C) Relative abundance of pdzd8 transcript in controls compared with pdzd8-RNAi normalized to the relative to geometric mean of housekeeping genes αTub84B, vkg, COX8, and Rpl32; P = 0.0134. (D) Replicate of Fig 1B LacZ-RNAi with high magnification examples of MERCs (D′-D‴). Scale bar 500 nm. (E) Representative structured illumination microscopy images of ER (green) and mitochondria (purple) in L3 larval neurons. Scale bar = 5 μm.

