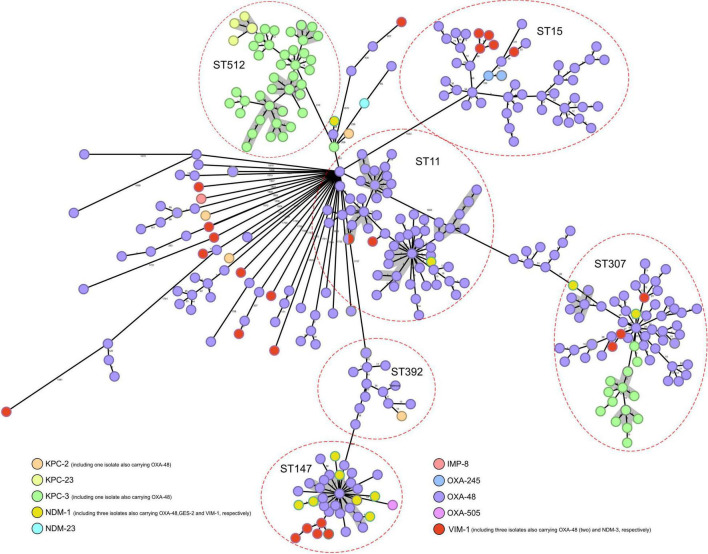
FIGURE 3.
Population structure of carbapenemase-producing Klebsiella pneumoniae: minimum-spanning tree. Distances shown are based on cgMLST of 2,358 genes using the parameter “pairwise ignoring missing values.” Colors in each circle indicate carbapenemase type. Red ovals represent clusters. Circles can correspond to more than one isolate, indicating that they are identical. Gray shadows represent clusters of strains, applying a threshold of both 5 SNPs and 10 alleles.

