Figure 7.
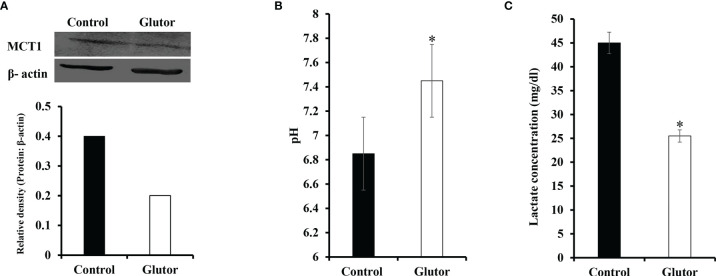
Glutor interferes with pH homeostasis of DL cells. DL cells (1 × 10⁵) were incubated for 24 h in a medium alone or containing glutor (0.01 µM), followed by an examination of MCT1 expression by Western blotting as described in the Materials and Methods section. The culture media of control and glutor-treated DL cells were also examined for pH and lactate levels. The plates shown in (A) are from a representative experiment out of at least two experiments with similar results. The accompanying bar diagram depicts the densitometry of the bands. Values in (B) and (C) are mean ± SD. *p < 0.05 vs. respective control.

