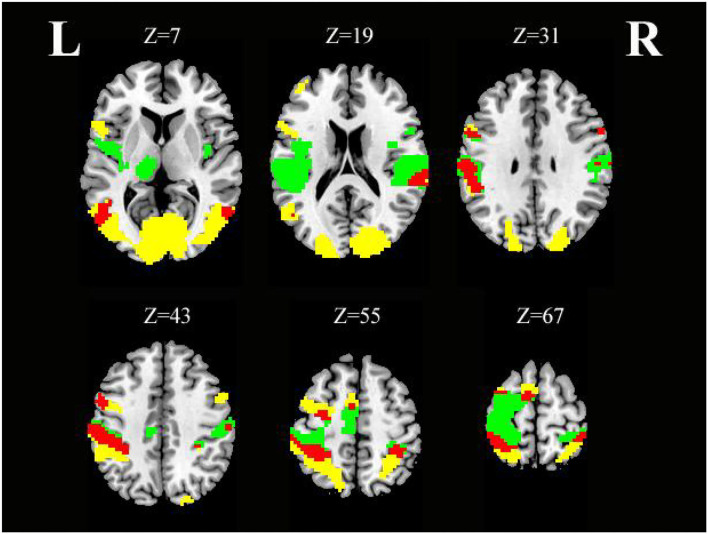
Figure 5.
Axial slices with corresponding Z-coordinates (MNI) from the t-value map for similar activation of SO and SS; yellow activation shows areas recruited by SO, green activation shows areas recruited by SS, and red areas represent activation overlap between SO and SS, respectively (voxel-level, FDR-corrected p < 0.001, cluster size > 10 voxels). MNI, Montreal Neurological Institute; SO, sensory observation; SS, somatosensory stimulation; FDR, false discovery rate; L, left; R, right.

