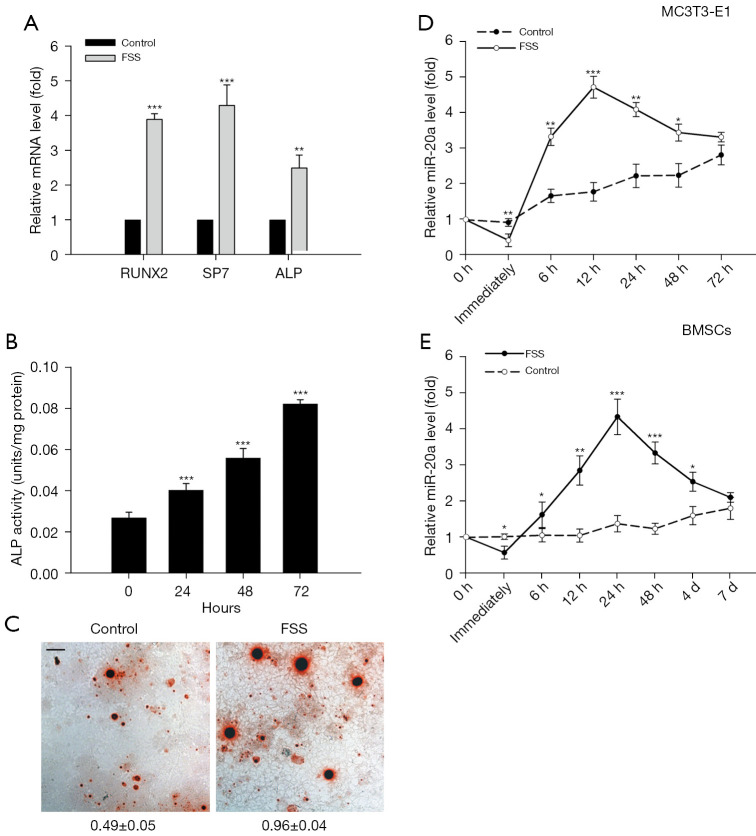
Figure 1.
MiR-20a was spatiotemporally up-regulated during FSS-induced osteogenic differentiation. (A) mRNA levels were normalized to GAPDH for the osteoblast biomarkers (RUNX2, SP7, and ALP) at 12 h after FSS treatment (pf.). (B) ALP activities were measured during FSS-induced differentiation. (C) Mineralization of the ECM. FSS treated cells were stained with ARS on day 14 pf. ARS staining was quantified by cetyl-pyridinium chloride extraction. Absorbance was assessed at 560 nm. Relative IOD of Alizarin red S staining was calculated and the relative means and standard deviations were shown under each picture. (P<0.001; scale bar: 50 µm). (D) Spatiotemporal expression levels of miR-20a in MC3T3-E1 cells pf. (E) Spatiotemporal expression levels of miR-20a in mice BMSCs pf. Data are expressed as mean ± SD for n=3; *, P<0.05 vs. 0 h group; **, P<0.01 vs. 0 h (control) group; ***, P<0.001 vs. 0 h (control) group. FSS, fluid shear stress; GAPDH, glyceraldehyde-3-phosphate dehydrogenase; RUNX2, Runt-related transcription factor 2; SP7, SP7 transcription factor; ALP, alkaline phosphatase; pf., post-FSS treatment; ECM, extracellular matrix; ARS, Alizarin red S; IOD, integrated optical density; BMSCs, bone marrow stromal cells.

