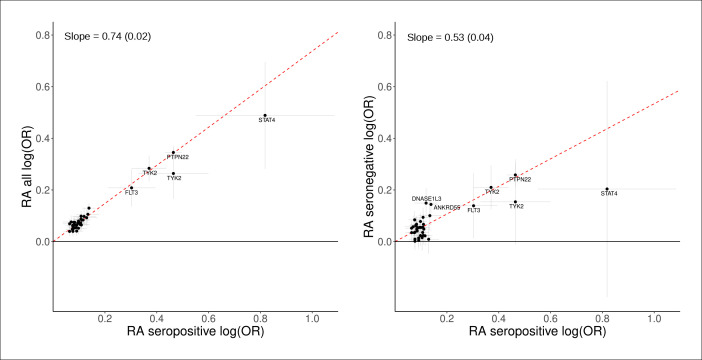
Figure 1.
Effects of the lead sequence variants associated with seropositive RA (18 019 cases) compared with RA overall (31 313 cases, left graph) and seronegative RA (8515 cases, right graph). The x-axis and the y-axis show the logarithmic estimated ORs for the associations with the three phenotypes. All effects are shown for the RA risk increasing allele based on current meta-analysis of study population from six countries in Northwestern Europe (table 1). Error bars represent 95% CIs. The red line represents slope (SD) based on a simple linear regression through the origin using MAF (1-MAF) as weights. See further results in table 2 and online supplemental tables 2; 3.

