Figure 3.

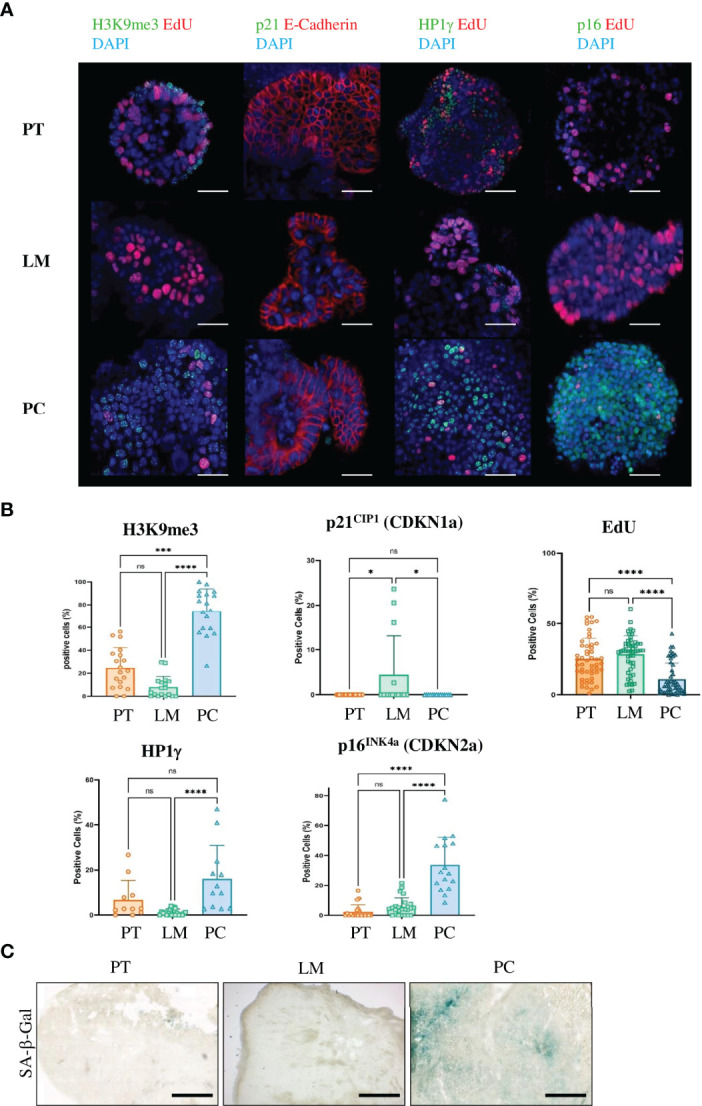
Only cancer cells from metastases in the peritoneal cavity of the APTAK mouse model show a senescent phenotype. (A) Representative immunofluorescence (IF) images of the senescence-associated markers H3K9me3, p21CIP1, HP1γ and p16INK4a (all green) from organoids derived from primary tumors (PT), liver metastases (LM) and PC from the orthotopic organoid transplantation CRC mouse model. The proliferation marker EdU was stained in red and nuclei were stained in blue. p21 was combined with the cell membrane-bound E-Cadherin (red) and not with EdU. Scale bars represent 50 µm. (B) Quantification of IF markers per group derived from primary tumors (n = 5 mice), liver metastases (n = 3 mice) and PC (n = 3 mice) from the orthotopic organoid transplantation CRC mouse model. 3-5 HPF per mouse and marker with at least 1000 APTAK cancer cells were analyzed. Error bars represent the mean ± SD. Kruskal-Wallis test (B) ****p < 0.0001, ***p < 0.0002, *p<0.05, n.s. = not significant. (C) Representative images of SA-β-gal from primary tumors (PT), liver metastasis (LM) and peritoneal carcinomatosis (PC) from a mouse of the orthotopic organoid mouse CRC model. n = 5 mice per group. Scale bars represent 1000 µm.
