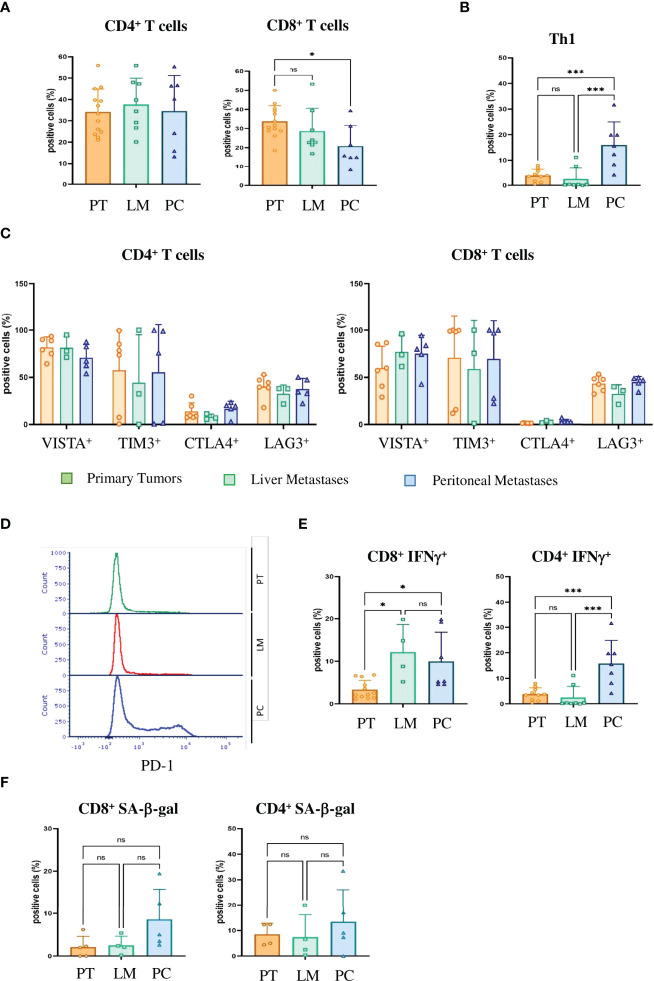
Figure 5.
Tumor-infiltrating T cells in PC express checkpoint inhibitor molecules, IFN-γ and markers of senescence and thus are immunosenescent (A) Flow cytometric analysis of the tumor infiltrating lymphocytes of primary tumors (PT), liver metastases (LM) and PC of the orthotopic organoid transplantation CRC mouse model for CD4+ and CD8+ T cells. Dotplots show the percentage of CD4+ and CD8+ T cells gated on CD3+ T cells (n = 13 for PT, n = 8 for LM, n = 7 for PC). (B) The number of IFN-γ secreting T helper 1 (Th1) cells evaluated by FACS in the tumor microenvironment of primary tumors (PT), liver metastases (LM) and PC of the orthotopic organoid transplantation CRC mouse model. Dotplots show the percentage of IFN-γ secreting CD4+ T cells gated on live CD45+ CD3+ T cells (n = 13 for PT, n = 8 for LM, n = 7 for PC). (C) Flow cytometric analysis of CD4+ (left panel) and CD8+ (right panel) T cells for checkpoint molecules VISTA, Tim3, CTLA4 and Lag3 in tumor infiltrating lymphocytes of primary tumors (PT), liver metastases (LM) and PC of the orthotopic organoid transplantation CRC mouse model. Dotplots show the percentage of the CD4+ and CD8+ T cells expressing the respective immune checkpoint molecule (n = 8 for PT, n = 3 for LM, n = 4 for PC). (D) Flow cytometric analysis of the expression of PD1 on tumor-infiltrating CD8+ T cells from primary tumors (PT), liver metastases (LM) and PC of the orthotopic organoid transplantation CRC mouse model. (E) Flow cytometric analysis from tumor-infiltrating CD8+ and CD4+ T cells for IFN-γ secretion of primary tumors (PT), liver metastases (LM) and PC of the orthotopic organoid transplantation CRC mouse model. Dotplots show the percentage of IFN-γ positive CD4+ and CD8+ T cells (n = 12 for PT, n = 4 for LM, n = 7 for PC). (F) Flow cytometric analysis of SA-β-gal positive tumor-infiltrating CD8+ and CD4+ T cells in the tumor microenvironment of primary tumors (PT), liver metastases (LM) and PC of the orthotopic organoid transplantation CRC mouse model. Dotplots show the percentage of SA-β-gal CD4+ and CD8+ T cells (n = 5 for PT, n = 4 for LM, n = 5 for PC). Error bars represent the mean ± SD. One-way ANOVA (A–C, E, F) ***p < 0.0002, *p<0.05, n.s. = not significant. In all analysis Zombie NIR staining was used to discriminate dead from live cells and only live Zombie-negative cells were quantified.

