Figure 6.

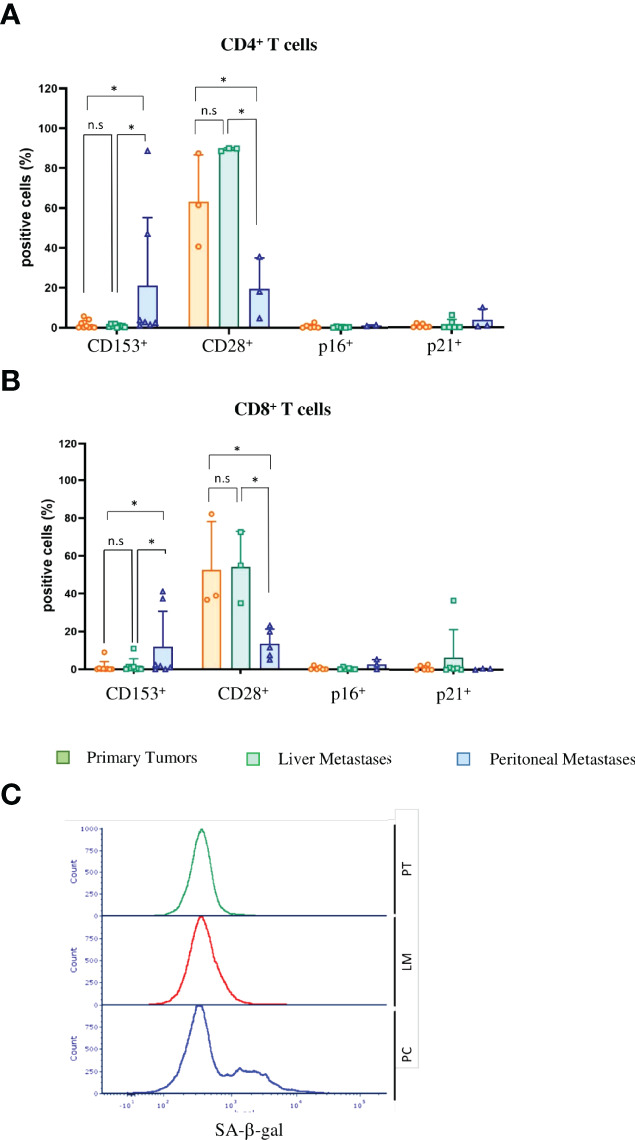
Tumor-infiltrating lymphocytes in PC show signs of immunosenescence in mice and men (A) Flow cytometric analysis of immunosenescence associated markers on tumor-infiltrating CD4+ T cells of primary tumors (PT), liver metastases (LM) and PC of the orthotopic organoid transplantation CRC mouse model. Dotplots show the percentage of CD4+ T cells expressing CD153 (n = 10 for PT, n = 7 for LM, n = 8 for PC), CD28 (n = 3 for PT, n = 3 for LM, n = 3 for PC), p16 and p21 (n = 10 for PT, n = 7 for LM, n = 8 for PC). (B) Flow cytometric analysis of immunosenescence associated markers on tumor-infiltrating CD8+ T cells of primary tumors (PT), liver metastases (LM) and PC of the orthotopic organoid transplantation CRC mouse model. Dotplots show the percentage of CD8+ T cells expressing CD153 (n = 10 for PT, n = 7 for LM, n = 8 for PC), CD28 (n= 3 for PT, n=3 for LM, n=3 for PC), p16 and p21 (n= 10 for PT, n = 7 for LM, n = 8 for PC). (C) Flow cytometric analysis of SA-β-gal in tumor-infiltrating lymphocytes from human patients with primary CRC (PT), liver metastasis and PC. The histogram shows the results of 5 patients each. Error bars represent the mean ± SD. One-way ANOVA (A, B) *p < 0.05, n.s. = not significant.
