
FIGURE 4.
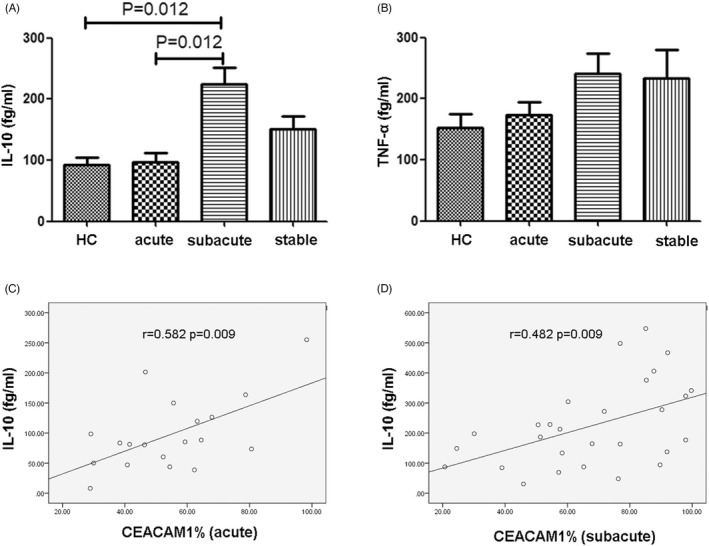
Content of IL‐10 and TNF in the plasma of patients with IS. (A) Comparison of plasma IL‐10 concentration in the IS patients and healthy control. (B) Comparison of plasma TNF concentration in the IS patients and healthy control. Statistical analysis was performed by the Mann–Whitney test. (C) Correlation analysis between plasma IL‐10 content and CEACAM1 positive neutrophils in the acute group. (D) Correlation analysis between plasma IL‐10 content and CEACAM1 positive neutrophils in the subacute group. Correlation determined by the Pearson correlation analysis. IL‐10, interleukin 10. TNF, tumor necrosis factor. IS, ischemic stroke