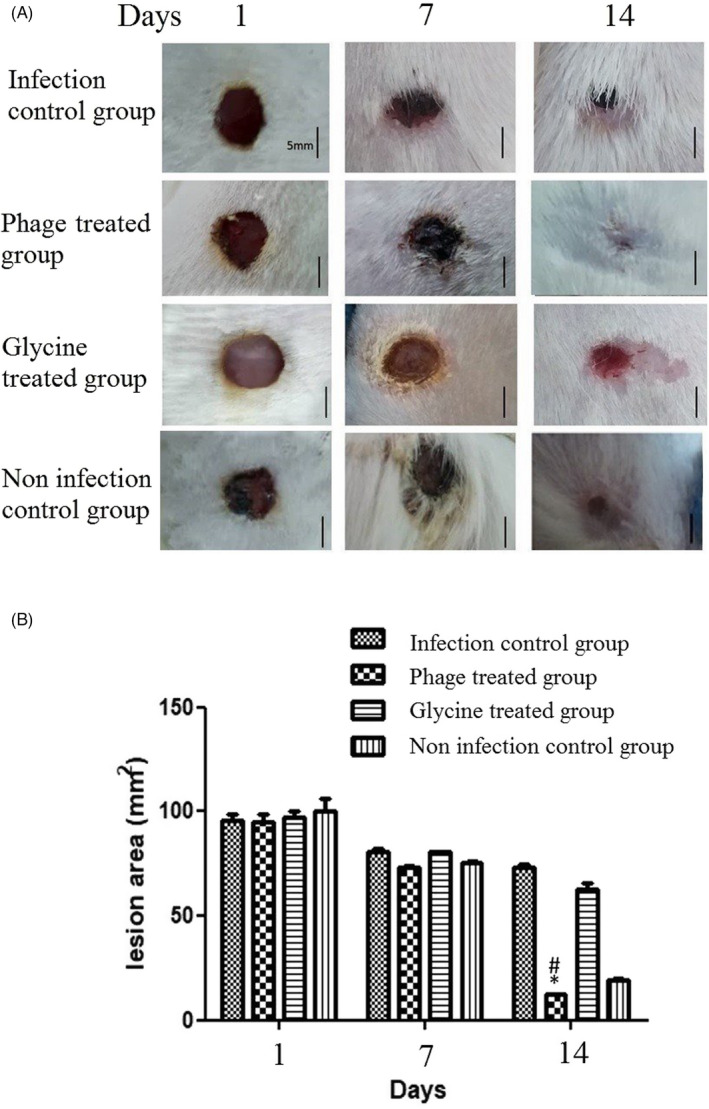
FIGURE 6.

(A) Wound area in different treatment groups. Representative lesion images take for each group on day 0, 7, and 14 after infection induce. The phage uses at first day of infection, and on the 14th day after infection, (B) The mean size of the lesion area was significantly smaller in the phage‐treatment group as compared to the cases of the non‐treatment group (P < 0.05). Moreover, five rats were considered for each group. Scale bar: 5 mm. (n = 2 rat per day; *P < 0.05 versus phage treatment and# P < 0.05 versus non‐treatment). Statistical significance was measured by one‐way ANOVA. Data are presented as mean ± SD
